Fertility rates are dropping all over the world. Life expectancy is increasing. This interactive infographic, based on data from the World Bank, really drives the point home. What do these trends mean for our future?
Activate the map to see the amazing change over time and explore the changes in different regions using the filters in the upper right corner.
Over-population has been a global concern for the past few decades and is still a buzzword. The concerns are valid. Global population recently achieved a milestone, hitting the 7 billion mark and currently stands at almost 7.2 billion.
On the other hand, declining birth rates also come with challenges and dangers for countries. The fertility rate in the United States fell to a record low in 2012 of 63 births per 1,000 women, or 1.8 children per woman. It takes 2.1 children per woman for a generation to replace itself. As there are less people to join the workforce, and fewer children to support a larger aging population, many economists forecast an era of stagnant economic growth.
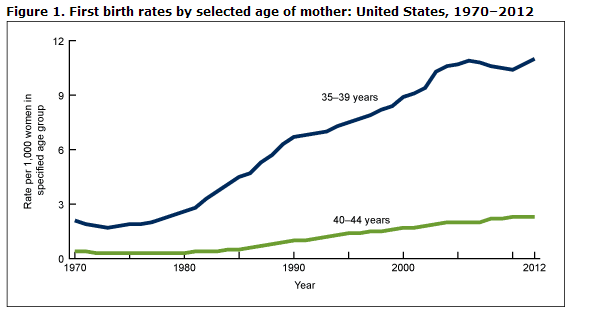
One of the main reasons in the West for the drop in birth rates is the steady rise of the age of first births. New data from the Center for Disease Control paints a dramatic picture: Women are starting to have babies much later in life.