Home Price Growth Slows as Inventories Jump, a Sign of Cooling in the Housing Market

Home Price Growth Slows as Inventories Jump, a Sign of Cooling in the Housing Market
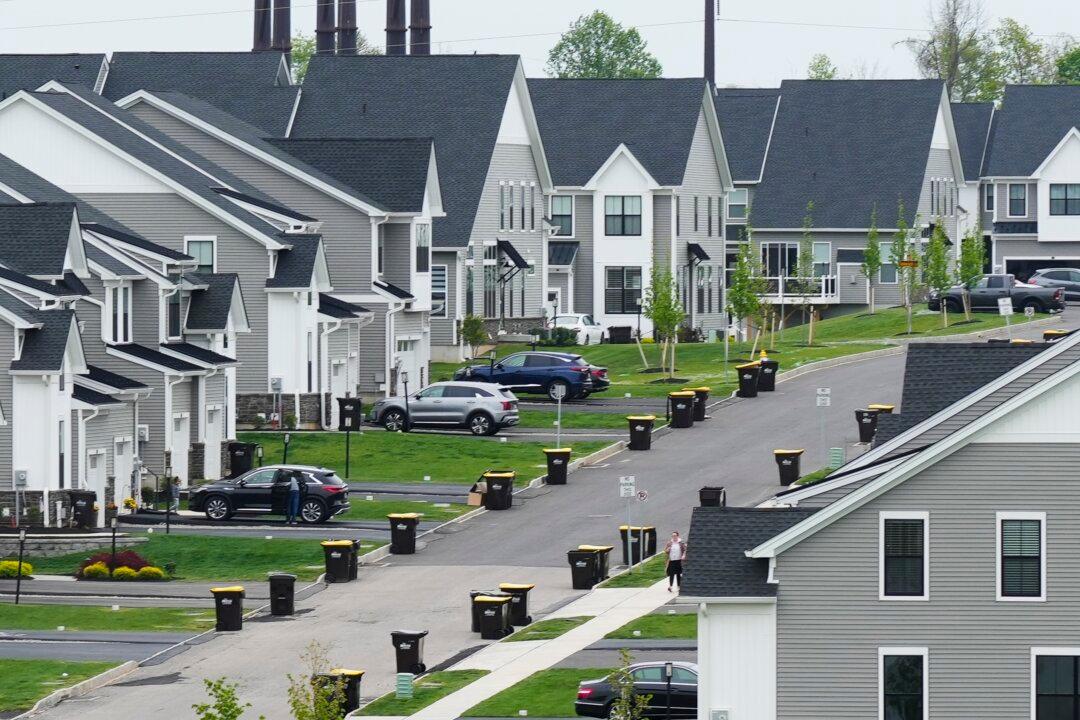
Rows of new homes line a street in a housing development in Oakland, Calif. on Dec. 4, 2013. (Justin Sullivan/Getty Images)
Bryan Jung
6/29/2022
Updated:
6/29/2022
0:00
U.S. home prices rose 20.4 percent nationwide in April compared with the same month in 2021, according to the S&P Dow Jones Industrial’s  CoreLogic Case-Shiller Index report on June 28 (pdf).

This, compared with a 20.6 percent rise in March, appears to be a sign of a cooldown in price rises. The last deceleration in prices was in November 2021.

The data released for April 2022 showed that home prices continued to increase across the United States.

“April 2022 showed initial (though inconsistent) signs of a deceleration in the growth rate of U.S. home prices,” said Craig Lazzara, Managing Director at S&P DJI.

“We continue to observe very broad strength in the housing market, as all 20 [metropolitan area] cities notched double-digit price increases for the 12 months ended in April.”

“April’s price increase ranked in the top quintile of historical experience for every city, and in the top decile for 19 of them,” he continued.

The S&P/Case-Shiller 20-city Composite Home Price Index measures the value of residential real estate in Atlanta, Boston, Charlotte, Chicago, Cleveland, Dallas, Denver, Detroit, Las Vegas, Los Angeles, Miami, Minneapolis, New York, Phoenix, Portland, San Diego, San Francisco, Seattle, Tampa, and Washington, D.C.

Only nine of the American cities at the end of April reported prices rising faster in contrast to the March report, which saw most of the 20 cities seeing month-to-month price increases for five consecutive months.

Metropolitan areas in the South—such as Charlotte, Tampa, Atlanta, Dallas, and Miami—saw the strongest monthly gains.

“Tampa (+35.8 percent) was the fastest growing city for the second consecutive month, with Miami (+33.3 percent) and long-time leader Phoenix (+31.3 percent) in second and third positions,” said Lazzara.

The cities with the smallest gains, but still reporting double digits, were Minneapolis, Washington D.C., and Chicago.

The 10-city composite annual increase was 19.7 percent, up from 19.5 percent in March, while the 20-city composite posted a 21.2 percent annual gain, up from 21.1 percent the previous month.

The U.S. National Index posted a month-over-month increase after seasonal adjustment, of 1.5 percent, and the 10-city and 20-city composites both posted increases of 1.8 percent.

All 20 cities listed in the survey reported increases before and after seasonal adjustments were made for April.

“Despite the deceleration of the National Composite and the modest acceleration for the 10- and 20-city composites, these growth rates are extremely strong by historical standards—at or above the 99th percentile in all three cases,” said Lazzara.

As the Federal Reserve begins to aggressively hike interest rates, banks are becoming less willing to issue mortgage assistance to buyers, leading to a cooldown in the market.

“We noted last month that mortgage financing has become more expensive as the Federal Reserve ratchets up interest rates, a process that had only just begun when April data were gathered,” said Lazzara.

A more challenging macroeconomic environment may not support extraordinary home price growth for much longer.”

In April, the average rate on the 30-year fixed mortgage crossed the 5 percent mark after moving up from around 3 percent in January, and by June, it had crossed 6 percent.

The rate hikes, combined with rising home prices, have pushed the average monthly mortgage payment to $1,897 in May—up $513, or 37.1 percent—in the first five months of the year, according to the Mortgage Bankers Association.

“The ongoing affordability hit of higher home prices and fast-rising mortgage rates led to a slowdown in purchase applications in May,” said Edward Seiler, Associate Vice President of Housing Economics at the MBA, in a June 23 statement.

“Inflationary pressures and rates above 5 percent are both headwinds for the housing market in the coming months.”

The housing market is already showing signs of cooling, with slower sales and price cuts by some sellers, with sales of existing homes in May dropping 3.4 percent to a seasonally adjusted annualized rate of 5.41 million units, according to the National Association of Realtors.

“I do anticipate a further decline in home sales,” said Lawrence Yun, Chief Economist at the National Association of Realtors, “the impact of higher mortgage rates are not yet fully reflected in the data.”

Sales figures are reporting the weakest readings since June 2020, during the early months of the pandemic; and the lowest since January 2020, after adjustments.

Meanwhile, the market cooldown has allowed the stock of available inventory for sale to gradually recover from the two-year housing shortage.

“Available inventory of homes on the market skyrocket 6.2 percent again this week. 444,000 single family homes now on the market. More inventory now than any time last year. Still 50-70 percent fewer than normal,” Mike Simonsen Co-founder CEO Altos Research, a real estate data site, wrote on Twitter.

More listings have come on the market, with many properties on it sitting idle for longer, while last week, active inventory was reportedly 21 percent higher than it had been the same week one year ago, according to Realtor.com.