An article, entitled “T-shaped Social Structure and The Structure Tension” by Professor Li Qiang, was published in 2005’s Issue 2 of the Sociological Research Journal in China . Li Qiang is professor of the Department of Sociology and the dean of the School of Humanities and Social Sciences at Tsinghua University. He analyzed the data of China’s Fifth National Population Census conducted in 2000 and concluded that the structure of the Chinese society is more like an upside down T-shape, with 64.7 percent of the population in the lowest level and at least 84.1 percent of the employed belonging to the lower class of the Chinese society. The remaining groups are distributed in a pole-shaped structure with no transition in between. Therefore, the majority of the Chinese population is considered poor or in a low class and the middle and upper classes account for only a very small portion of the population.
Professor Li selected 0.095% of the census data using a systemic sampling method, chose those ranging from 16 to 64 years old, and got a total sample of 641,547 people for the analysis. A small portion of data was missing after the sample was grouped into city residents and countryside residents. Li’s study indicated that at least 84.1 percent of the employed fell into the lower class.
This is very similar to the results reported in the book written by He Qinglian, a well-known social economist, titled “The Overall Analysis of the Transformation of the Current Chinese Social Structure”, which states that 84 percent of the population is in the lower class. Sociologists usually use analogies to describe the social and economic status of the population or the social structure. A society with a small portion of rich people, some people in the middle-class as the transition and a large poor population is classified as a pyramid-shaped structure. A society with a large middle-class as the main body and small portions in the upper and the lower classes is called an olive-shaped or spindle-shaped structure. The olive-shaped society usually has less social tension; the larger the differences are between the social classes, the more intense the tensions are. In He Qinglian’s book, the author concludes that China has a pyramid-shaped social structure. The Chinese government, however, claims it to be onion-head shaped instead. Experts believe that the pyramid-shaped structure is very bad, and that the inverted T-shaped structure is even worse. Li thinks this kind of society provokes social conflicts; hence he calls it a structure of tension. Merton, an American sociologist stated that a society with a structure of tension is seriously out of balance in the aspect of expectation for success and the means to gain success. It is the time when social conflicts, crimes and clashes increase sharply.
How Did the Researcher Come up with an Inverted T-Shape?
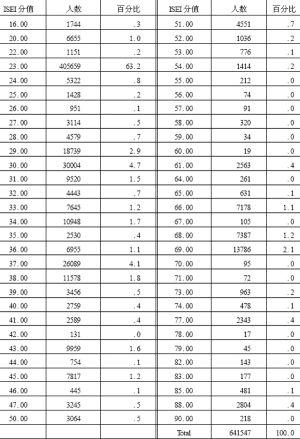
Li Qiang started by scoring each occupation in the Chinese society based on its social and economic status. The lower the score, the lower its income and social status; the higher score, the higher its income and social status. The scores are also called ISEI scores [1], which are widely used figures around the world to indicate people’s social status and income.
We clearly see from the chart that it reflects an inverted T-shaped social structure, which is even worse than the pyramid-shaped social structure that has a wide gap between the haves and the have-nots. 64.7 percent of the samples (the groups scoring below 23 points) score very low. This is a strong contrast over other groups, which resemble an upright pole. Dramatic differences are thus presented. We will proceed to look at the few groups with relatively larger percentages and their corresponding occupations. 64.7 Percent Of The Total Population Belongs To The Lowest Class
Farmers And Garbage Recyclers Account For 63.2 Percent Of The Workforce. The most noticeable part of the chart is the group scoring 23, which is 63.2 percent of the total workforce. This group corresponds to the occupation of farming, including planting, agricultural product processing, animal husbandry, poultry farms, garbage recycling and cleaning, etc. They form an enormous group on the lowest level of the inverted T-shaped social structure.
Migrant Workers With Their Social Status Close To That Of Farmers Total 9.1 Percent Of The Workforce. The group scoring 29-31 lies on the upright pole, but has a slightly larger population. It totals 9.1 percent of the workforce. The group includes construction workers, earth and rock workers, concrete processing workers, scaffold workers, geology prospecting workers, coal and metal ore miners, carpenters and joiners, metal products manufacturing workers, moving labors, rickshaw pullers, takeout delivery workers, transportation laborers, loggers, slaughter house workers, meat processing workers, fur producing and processing workers, shoemakers, and manual laborers among others. Many of these workers were transferred from farmers and they are workers for village enterprises. Their real social status and living standard are close to those of farmers.
10.3 Percent of the Workforce is Between the Blue Collar and the White Collar
Another occupation with a relatively large population scores 33-38. They represent 10.3 percent of the total workforce. The corresponding occupations are transportation workers for highway, railroad, waterway, and other transportation services; business service workers for general services and restaurant service; mechanical and electronic product assembly workers, mechanical and power equipment assembly workers, mechanics, electronic component and equipment manufacturing and assembly workers, meter and instrument technicians, arts craftsmen, musical instrument craftsmen, electric-power generator assembly workers and mechanics, semi-skilled chemical technicians, and semi-skilled manufacturing technicians, etc. This class is between the blue collar and the white collar. It can be called the higher level of the blue collar or the lower level of the white collar.
Five Percent of the Workforce are White Collars
As we move up along the pole the ratios become even smaller. Only 2.3 percent of the people fell into the 43-45 score group. They are elementary school teachers, kindergarten teachers, nurses, general administration staff, general office clerks, general business employees, business service employees, salespeople, exhibition sales and purchasing professionals. They are typically considered as the white-collar group.
The group scoring 68-69 is about 2.6 percent of the total working population. They are mainly managers, directors, technical resources and designers of manufacturing, sales and service organizations; technology professionals and engineers of electronics, electrical power, radio and television broadcasting, filming and transportations; middle school teachers, technical college instructors and administration professionals.
In the group with higher scores, the group of 85-88 has a slightly higher portion, but representing only 0.5 percent of the total working population. They are high-end professionals such as managers and directors in the banking, financial and securities industries; doctors, professors and high-level technical resources; government officials, lawyers, judges and other high-level legal personnel.

Who’s At The Top? How Many Of Them?
Mrs. He Qinglian points out in her research that 5 percent of the total population in China can use their power to grab money. They are mainly senior leaders of the governments, including provincial, regional and central governments; leaders and their subordinates in state-owned banks and state-owned large enterprises, as well as businesses jointly owned by the government and private businessmen.
The chart published by Professor Li Qiang shows that the top three groups are far less than 5 percent of the total population. Li’s research data doesn’t include the income of corrupt officials in Mainland China. Therefore, the actual situation in China is far more dangerous than what Li Qiang’s research indicates.
Notes: [1]: ISEI value is a measured score of each occupation’s social status and income.