Measuring Monetary Restraint
There are two ways to measure the impact of monetary policy. One is to use the change in interest rates. This is the Fed’s preferred measure. Specifically, the Fed targets the overnight federal funds interest rate as its main tool to set monetary policy.Based on short-term interest rates, the Fed’s policy of monetary restraint began in March 2022 with the Fed increasing the fed funds rate from essentially zero percent to 0.3 percent. Successive Fed moves have increased the effective rate to its current level of 4.8 percent. The change from zero percent to 4.8 percent represents the greatest yearly increase since 1981. At that time, faced with runaway inflation, the Fed raised the fed funds rate from 9.5 percent to 19 percent. As today, the aggressive upward move in 1981 followed the Fed’s massive expansion in the money supply.
The second way to measure monetary policy is to track the amount of money in the economy. Among the problems with measuring the money supply are the numerous alternative money indexes from which to choose. Each of these measures is affected by institutional changes, which can cause shifts in money balances, making it difficult to identify the appropriate money measure.
My solution to this conundrum has been to measure the amount that is entering or leaving the economy. Fed purchases and sales of securities offer the most common way of measuring this change. When the Fed purchases securities, it puts money into the economy, putting downward pressure on interest rates. The opposite occurs when the Fed sell securities. It takes money out of the economy while putting upward pressure on interest rates.
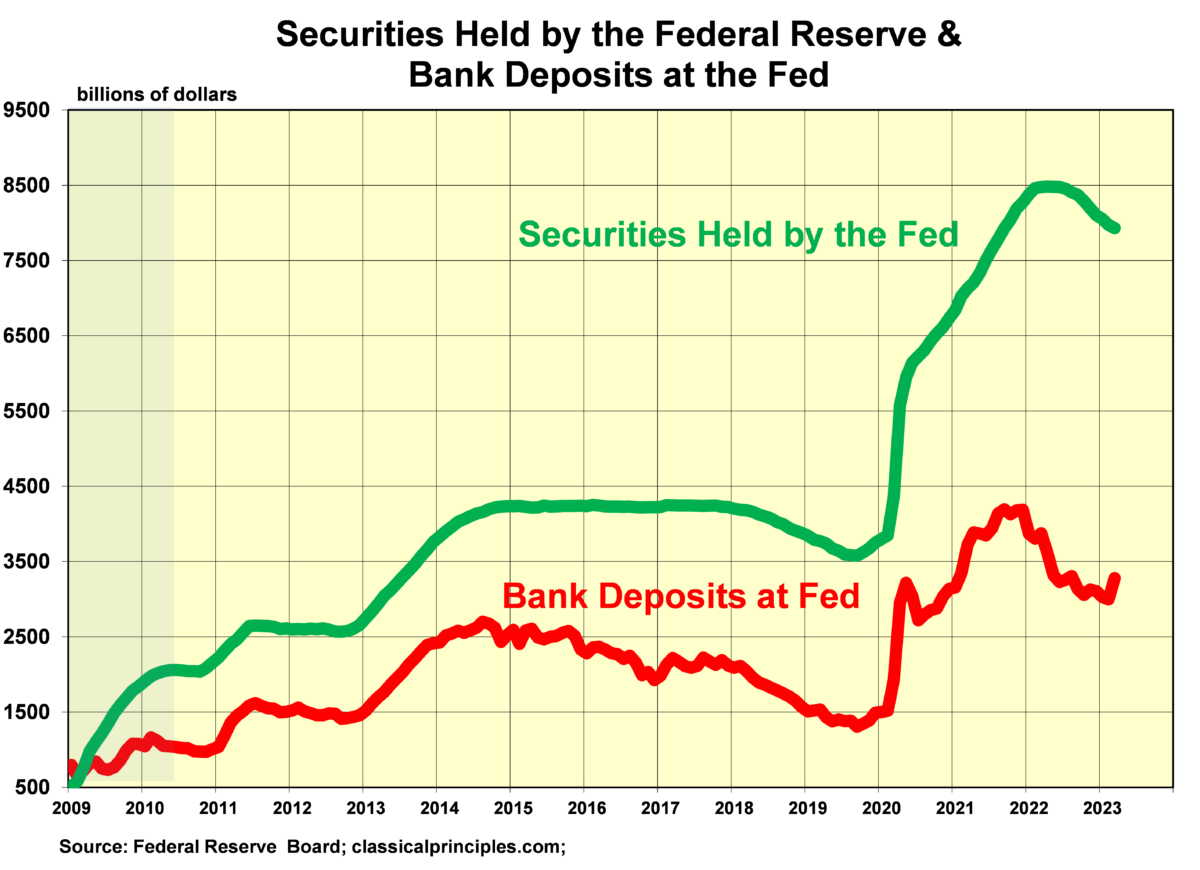
Historically, Fed purchases and sales of securities were often the main source of adding to or removing from the economy. Beginning in 2009, the Fed purchased so many securities that banks could not use all the new bank reserves the Fed created. Instead of loaning and investing their surplus of new funds, banks left the excesses on deposit with the Fed. Bank reserves at the Fed are not money circulating in the economy. They are potential money that can enter the economy once banks use them for loans and deposits.
The interesting thing about bank deposits at the Fed is how they have behaved as a buffer to the Fed’s policy. When the Fed purchased more securities than banks could use, banks tended to leave the excess at the Fed. The same occurred when the Fed decided to sell securities and take money out of the economy. As the following chart shows, bank deposits often offset the full impact of the Fed’s purchases and sales of securities.
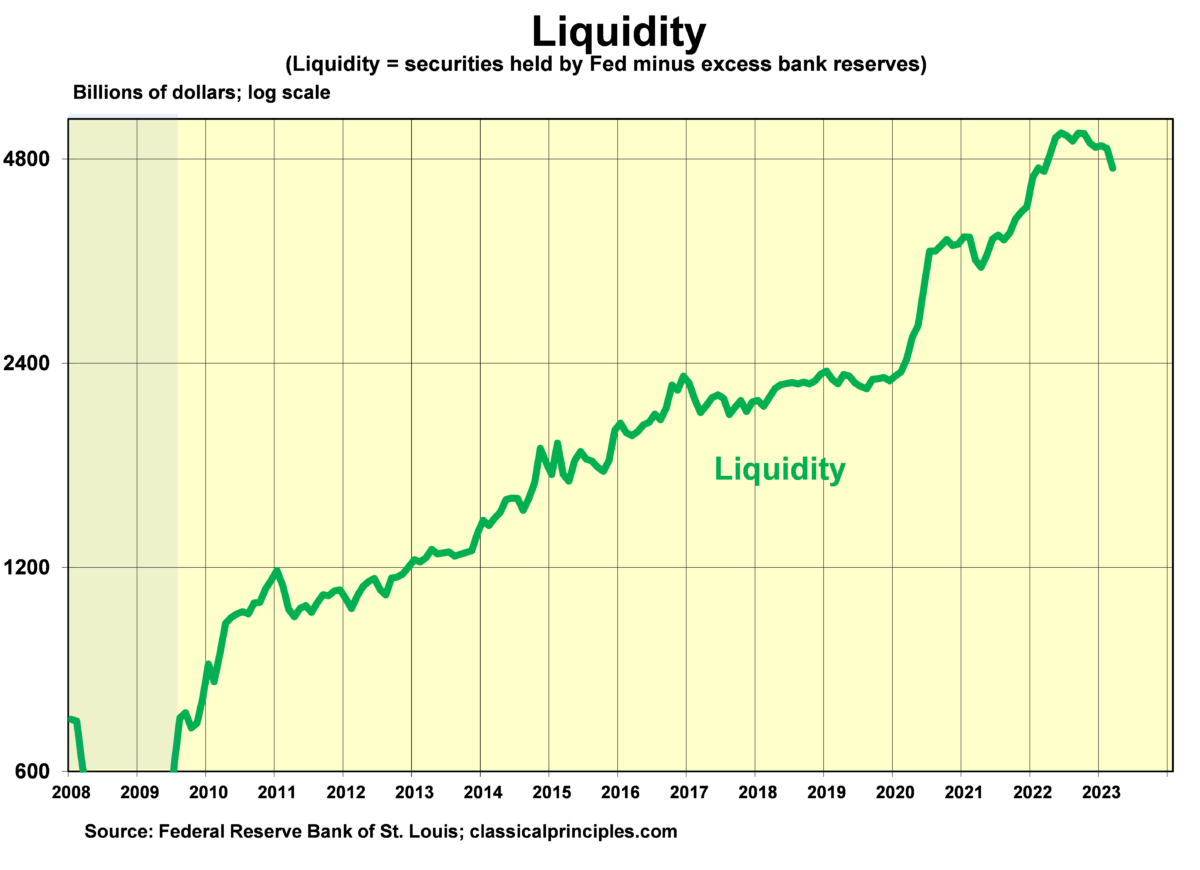
Measuring the volume of money in the economy requires tracking both the Fed’s purchases (and sales) as well as the level of bank deposits at the Fed. The next chart shows the effect of these two actions. It shows that in the nine months ended in March 2022, $593 billion has been taken out of the economy.
How Much Monetary Restraint?
Shifting from double-digit increases in money to essentially zero increases for the past year is a major policy shift. This shift was no doubt necessary to offset some of the prior surge in money.Monetary policy does not exist in a vacuum. The combination of higher interest rates, along with no growth in money over the past year, had a major impact on sensitive areas of the economy. Two of the earliest and most sensitive indicators—stock prices and housing—are down 14 percent and 25 percent, respectively.
Another indicator of monetary restraint is the spread between short-term interest rates and longer-term interest rates. Under normal monetary conditions, longer-term rates are above shorter-term rates. However, when monetary policy is restrictive, the yield curve is inverted with shorter-term rates above longer-term rates. The following chart shows that, since the mid-1970s, each time short-term rates have gone above long-term rates, a recession has followed.
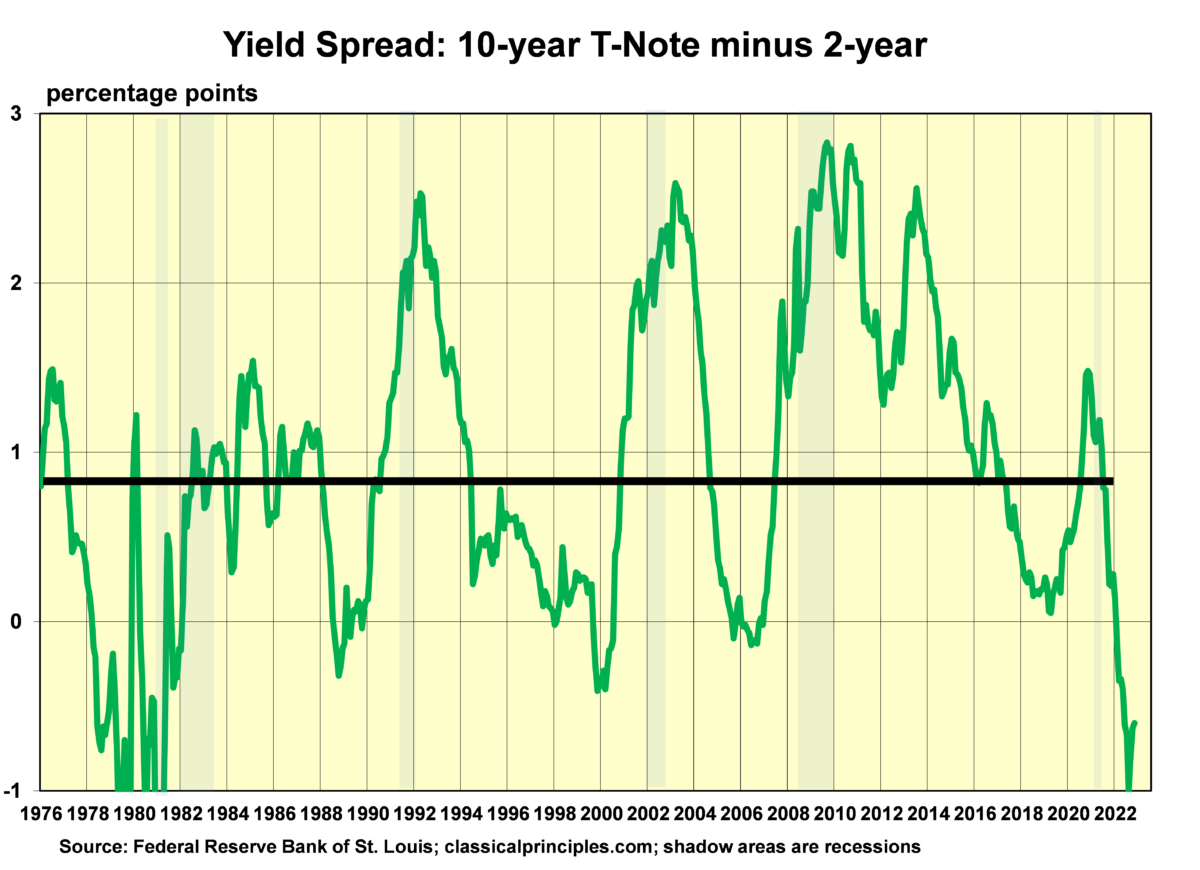
Currently, the yield has the three-month T-bill rate at 4.75 percent, about 1.25 percentage points above the 10-year Treasury yield. This is the most inverted this yield curve has been since 1981. Hence, the inverted yield curve and the change in the level of short-term interest rates both signal significant monetary restraint.
How Will Monetary Restraint Impact the Economy and Inflation?
The economy tends to respond to a change in monetary policy six to nine months after it begins. If monetary restraint began in June last year, signs of a slowdown should appear between January and June of this year. February data for consumer spending and wages are only the first hints of slower growth and possible progress on inflation.Based on the amount of monetary restraint in the nine months ended March 2023, we should expect to see more signs of economic weakness in the months ahead. If monetary policy remains restrictive, the coming recession is likely to last through to the end of 2023. Given the relatively quick rise in rapid inflation, the expected weakness in the economy should be sufficient to reduce inflation to a range of 2.0–3.0 percent by the end of this year.
One cautionary note in this optimistic scenario is fiscal policy. The strong recovery from the 1982 recession was due in large part to the Reagan tax cuts and containing federal spending relative to spending in the rest of the economy.
Today’s economic climate is different. Instead of tax cuts and limits on federal spending, which produce a strong revival in productivity, current fiscal policies include higher taxes and no meaningful control over federal spending and regulations. These anti-growth policies have led to a decline in productivity this past year.
If last year’s productivity decline continues, the Fed will have to clamp down harder and longer to contain inflation. Such a development would extend the Fed’s fight to contain inflation well into 2024.