As the major stock market indexes hit all-time highs, investors are challenged to evaluate how high stocks can go and how much they may be overvalued. Correctly assessing values helps investors understand the risks in holding stocks.
There are a number of ways to assess the stock market’s value. Fundamentals, such as earnings and interest rates, form the basis for value, while investor expectations also play a major role in determining extreme moves in the market.
Because there are no practical limits to people’s expectations, there is no practical upper limit to stock prices. However, there is a potential high mark for stocks based on how far extremes in expectations have driving stock prices. The most recent example of an upward extreme occurred during the so-called dot-com boom at the turn of the century.
US Market Value as a Percent of GDP
Some analysts use the relationship between the stock market and gross domestic product (GDP) as a rough guide to value. The following chart shows the market value of all U.S. stocks relative to GDP. At the end of 1999, amid the peak of speculative excesses, the value of U.S. stocks was 180 percent above the value of U.S. output. In 2007, just prior to the financial crisis of 2008–09, stocks were 134 percent higher than the GDP. They peaked at more than 200 percent at the end of 2021 as the economy recovered from the COVID-related government shutdown. At the end of 2023, the value of U.S. stocks to GDP was comparable to where it was in 1999.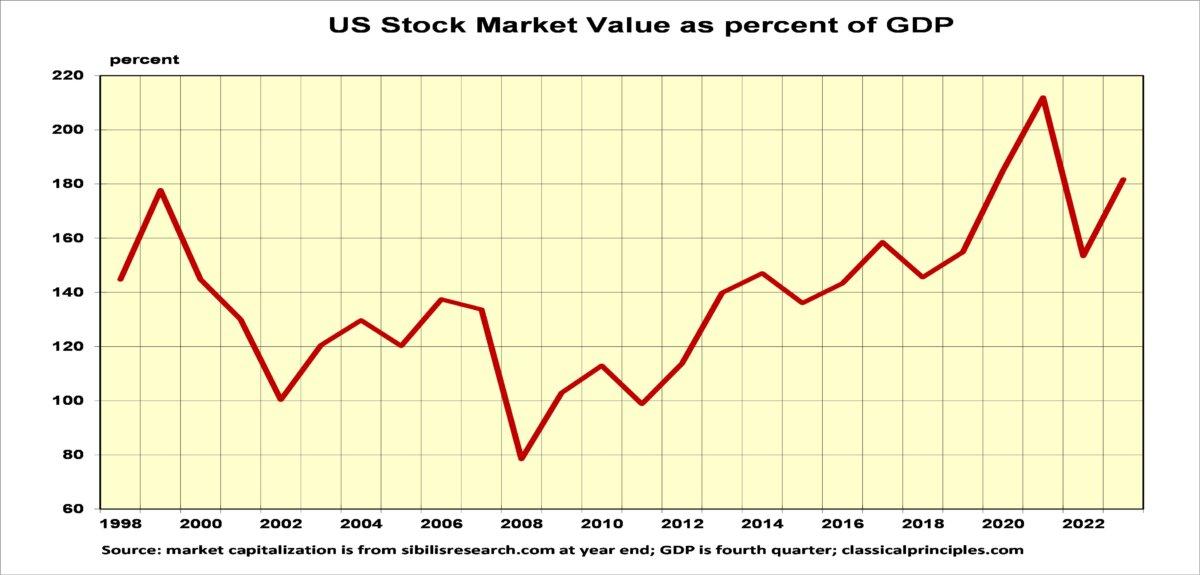
US Stock Values and Corporate Profits
While the ration of stock values to GDP provide one perspective on the market’s valuation, it uses the economy as a proxy for a key stock market fundamental—corporate profits. The following chart shows the relationship between the market value of stocks and all corporate profits.

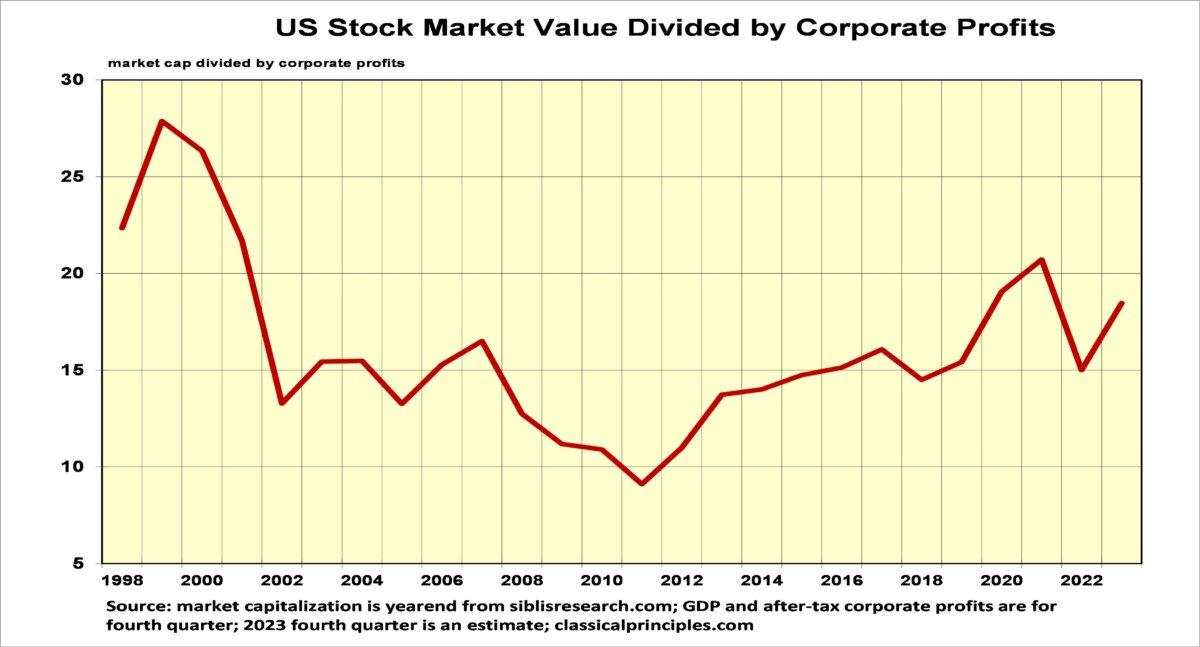
Dividing the market value of stocks by profits produces a price-to-earnings (P/E) ratio for the entire market. For the total U.S. market, the average P/E the past 25 years has been 16. During the dot-com boom, the P/E ratio was 28, indicating a significant overvaluation in stocks.
It also can be instructive to compare the value of the S&P 500 to its companies’ earnings. As the next chart shows, the S&P 500 P/E pattern is different from that of the overall U.S. market. The overvaluation in 1999 still is apparent with P/E ratios close to 30. However, the collapse in profits after the turn of the century was greater for S&P 500 earnings than the decline in all companies’ profits. When profits collapse, the increase in P/Es is due more to the collapse in profits than to excessive speculation over what stocks are worth.
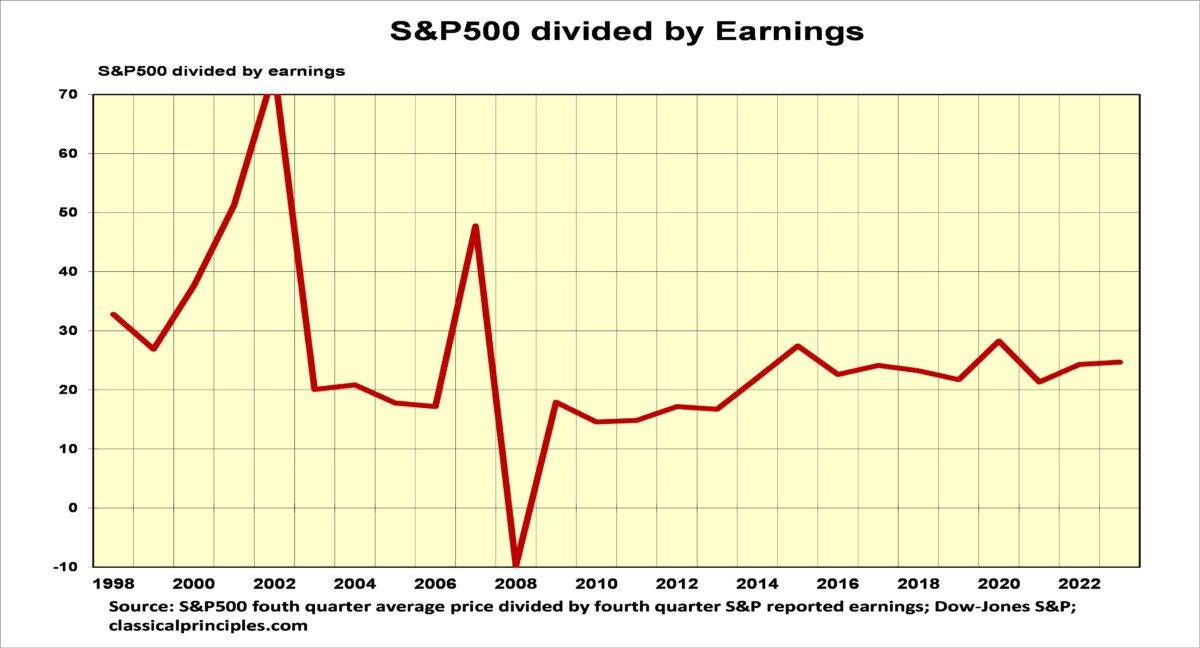
By 2003, S&P 500 profits recovered and the P/E stabilized at close to 20. The average P/E since 2003 has been 21. The abrupt up and down in 2007 and 2008 reflect a cyclical peak in profits at the end of 2007 followed by the collapse in profits due to the financial crisis. At the end of 2023 the P/E ratio was 24.7, higher than average, but lower than the dot-com boom.
Interest-rate adjustments are also important when evaluating P/E ratios. When interest rates are high, all assets including stocks tend to be worth less than when interest rates are low. Hence, it is appropriate to adjust P/E ratios to account for such differences.
How Overvalued Are Stocks Compared to the Dot-com Boom?
In the fourth quarter of 1999, P/E ratios for S&P 500 companies were well above the fourth quarter of 2023. Interest rates were also higher in 1999 with corporate bond rates above 7 percent. Hence, the overvaluation in the stock market during the dot-com boom was substantially greater than today. After adjusting for both earnings and interest rates, our analysis shows S&P 500 stocks sold for more than twice their underlying value in 1999.At the time of the financial crisis in early 2008, the S&P 500 expectations changed dramatically. The S&P 500 went from selling for 20 percent above value in late 2007 to selling for half of its value at the beginning of 2009. Even after the crisis subsided, expectations for stocks were so limited that they sold for less than their estimated value for the next twelve years.
Finally, in the spring of 2021 investor expectations to recover sufficiently for stocks prices to move above their estimated value. After more than 15 years of rising stock prices, investors have a strong positive bias for stocks. This has kept stock prices consistently above their value.
Our analysis based on both profits and interest rates shows that with the S&P 500 currently near 5,100, stocks are selling for 28 percent more than their fundamental value.
Optimism over the prospects for upcoming profit increases and declines in interest rates are keeping stock prices well above their fundamental values. Any shortfall in either of these expectations will take some of the wind out of current expectations and send stock prices down.
However, after 15 years of almost uninterrupted upward moves, there is a strong positive bias to keep stock prices above their fundamental value. This will continue until the next shock to the economy reestablishes a more balanced view of the risks associated with holding stocks.