Economists often say stocks are worth whatever people will pay for them. While true, this information isn’t very helpful. We already know what people will pay for stocks. Just look up current prices. What people really want to know is where stock prices are heading.
While the price of stocks is correct at a single point in time, prices change as conditions change. There are so many things that affect the market from day-to-day, or even hour-to-hour, no one can tell you what all these things are, no less forecast their changes.
However, some factors are fundamental to valuing stocks—earnings and interest rates. Understanding the longer-term trends in these two factors can provide useful information about the fundamental value of stocks. Comparing current prices to fundamental value can then help to determine the extent to which stocks are undervalued or overvalued.
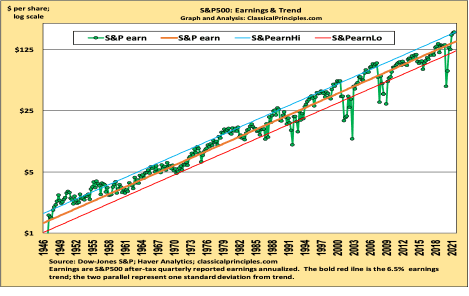
To estimate a stock market’s fundamental value, it helps to look at the earnings trend for the S&P500 companies. The most interesting thing about this trend is it has increased by 6 and a half percent a year since the late 1940s. As the chart below illustrates, actual earnings have moved above and below this trend, with a strong tendency to gravitate back to the trend.
Ideally, we would like to know where actual earnings are going in the year ahead. This is often difficult, if not impossible. There have been a number of times when, even after the quarter ends, analysts’ estimates miss actual earnings by 20 percent or more. If we can’t count on earnings estimates after the quarter is over, imagine the difficulty of reliably forecasting future earnings.
One solution is to observe where earnings are relative to their longer-term trend. Since this trend has survived vastly different periods of political and economic turmoil, it appears to be driven by powerful economic forces. If so, this longer-term earnings growth can provide a reliable guide to estimating the likely direction of future earnings. When reported earnings are well above this trend, the odds suggest they will be moving lower. Similarly, when earnings are well below this trend, they are likely to be increasing.
For the third quarter of 2021, the annualized earnings for the S&P500 companies were $198 a share. This was 30 percent above the third-quarter longer-term earnings trend. Hence, it’s reasonable to expect pressure on earnings to move down from their third-quarter high level.
In addition to earnings, interest rates also play an important role in valuing stocks. Financial asset theory tells us the value of stocks depends on future earnings discounted by the appropriate interest rate. While the formula is complicated, the relationship is not. Simply, when interest rates are low, the value of corporate earnings are worth much more than when interest rates are high.
Hence, when the interest rate on bonds is 2 percent, the earnings from stocks are worth far more than when interest rates are 5 percent. This relationship allows us to use the long-term earnings trend to estimate future earnings and adjust those earnings for the current level of interest rates.
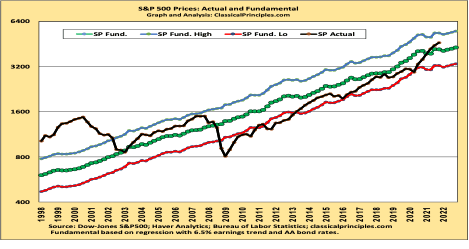
In the chart below, the fundamental value of the S&P500 is determined by a regression analysis. The price of the S&P500 is the dependent variable and the longer-term earnings trend and current corporate bond rates are independent variables. The fundamental value of the S&P500 can then be generated and compared to the actual S&P500 index to determine when stock prices have been significantly above or below their fundamental values.
Over the past 70 years, the most significant overvaluation occurred in late 2000. During this period (known as the “.com boom”), stocks were selling for twice their estimated fundamental value. The next most significant overvaluation occurred in 2007, just prior to the financial crisis. At that point, those buying stocks were paid 25 percent more than their value. In the aftermath of the financial crisis in 2008, the S&P500 companies were selling for half their estimated value!
Since late 2008, the Federal Reserve has held interest rates artificially low in an effort to stimulate the economy. By holding interest rates below market forces, the Fed has increased the value of corporate earnings as well as the value of stocks. Artificially low interest rates punish savers while benefiting debtors and stockholders.
Investors were slow to realize the increase in the value of stocks following the financial crisis. Instead, even though stocks were often selling for 20 percent less than their value, investors were reluctant to believe it. Stock prices remained below value until the end of 2020. After more than a decade of mostly higher stock prices, investors became more comfortable paying higher prices. Beginning in 2021, the price of the S&P500 moved above its fundamental value.
For the fourth quarter of 2021, the S&P500 was 11 percent above its estimated value. The increase in the long-term earnings trend will gradually raise the estimate of fundamental value in 2022. However, increases in interest rates will send the estimate of value in the opposite direction. The increase in corporate bond rates from 2.6 percent in the fourth quarter of 2021, to the current vicinity of 3 percent in early February, lowered the estimated value of the S&P500 from 4,200 to 4,100. For purposes of illustration, the fundamental value through 2022 assumes bond rates remain near 3 percent. However, many expect interest rates to move higher. If the interest rate on bonds increases to 4 percent by the end of this year, it will reduce the fundamental value of the S&P500 in the fourth quarter of 2022 from 4,300 to 3,900.
With the S&P500 currently in the vicinity of 4,500, the market is currently 11 percent overvalued. Should long-term interest rates rise to 4 percent, the current overvaluation would increase to 15 percent.
Using earnings and interest rates to determine the fundamental value of stocks can provide useful longer-term insights as to whether stocks are over or undervalued. What is missing from this analysis is a major short-term force that could be pulling stocks even higher. The short-term force is the amount of new money or liquidity entering the economy. The impact of money on stock prices is the topic for my next article.