Previously, I explained how the Fed’s policy of buying and selling securities impacts interest rates and stock prices. The biggest change in purchases (or sales) in securities occurred from mid-2007 through mid-2008. Then, the Fed sold 40 percent of its holdings of securities. The move reduced this component of money back to 1999 levels. This lack of money produced a liquidity shortfall, a collapse stock prices, and a collapse in the economy.
In February 2009, the Fed began repurchasing securities to restore money. The stock market began to recover in March. By April, the Fed not only had completely replaced all the securities it had sold, it added an additional $200 billion. By July, the economy began to recover.
Over the next four years the Fed bought an unprecedented $3 trillion in securities. This brought its total holdings to just over $4 trillion, the largest increase in bank reserves in history, exceeding the massive increase in security purchases used to finance World War II.
In late 2014, the Fed did a stop on purchasing securities. From 2018 to the end of 2019, the Fed sold $500 billion in securities. Such dramatic changes in the Fed’s security holdings normally would have a dramatic effect on stock prices and spending (current dollar GDP). Instead, from 2009 to 2019, yearly spending was extremely stable, with spending (GDP) growing in the narrow 3–5 percent range.
Why did the Fed’s massive security purchases not have a major impact on spending? How was it that the halting and then selling of securities, did not put downward pressure on stock prices and spending?
The answer: Most of the money the Fed created never made it into the economy. As always, the Fed’s purchases of securities created new bank reserves adding to the raw ingredients of the money, also called high-powered money. However, for these funds to get into the economy, banks needed to loan or invest their new bank reserves. If the banks keep their new reserves on deposit with the Fed, the new reserves do not increase the amount of money in the economy.
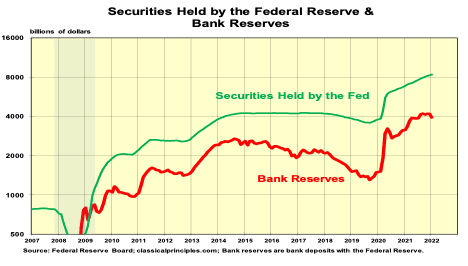
The above chart shows both the total securities the Fed holds and bank reserves (bank balances on deposit with the Federal Reserve. Note how the banks often have increased or decreased their deposits with the Fed. In doing so, the banks successfully offset many of the Fed’s dramatic changes in its holdings of securities. This stabilizing force is why spending was far more stable than Fed policy alone would have created.
To determine how much of the increase in money reaches the economy, it is necessary to take into account the Fed’s purchases of securities (new funds in banks) and subtract the funds banks leave on deposit with the Fed (which prevents those funds from being released into the economy).
The next chart shows the net effect of these two factors, which I’ve arbitrarily labeled ‘Liquidity.” Despite banks leaving much of their new funds with the Fed, Liquidity increased sharply during the first half of 2020. It then leveled off, before moving sharply higher in 2021.
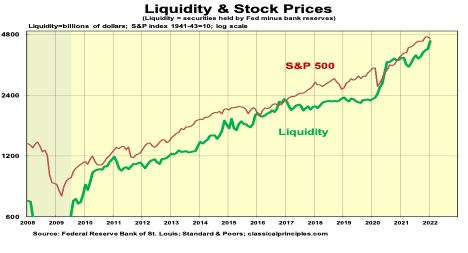
With COVID-19 and the government lockdown, the Fed went on another buying binge. As in its earlier binge, banks left much of their new reserves on deposit with the Fed. Since the spring of 2020, the Fed has continued to purchase securities at a steady rate of 10 percent a year. The increase in bank deposits with the Fed once again moderated liquidity growth in late 2020 and early 2021. However, over the past year, liquidity soared again, increasing at double-digit rates.
Historic increases in Fed securities purchases can be a powerful force driving stock prices higher. The substantial increases of money into the economy continued early this year. This liquidity increase should put significant upward pressure on stock prices as well as spending well into the second half of this year.
While monetary policy continues to push stock prices higher, other factors are pulling stock prices lower. As noted previously, stock investors always should consider the fundamental underlying value of stocks. My fundamental analysis of stocks uses the long-term earnings trend for the S&P500 index and interest rates on high-quality bonds, which produces an estimate of fundamental value.
In the fourth quarter of 2021, with the S&P500 at 4,600, my analysis estimated the value of the S&P500 at roughly 4,160. Hence, S&P500 stocks were selling just over 10 percent more than their value. Conditions have changed since then. In the fourth quarter, the interest rates on high-quality bonds were 2.6 percent. Currently, the interest rate is 3.3 percent. Higher interest rates reduce the value of stocks. At current interest rates, the value of the S&P500 is slightly below 4,000. Both the stock prices and their value have come down, leaving stock prices roughly 10 percent above value.
A key issue impacting the future value of stocks is how much interest rates increase in the year ahead. For example, if bond rates were to rise by a full percentage point, the fundamental value of the S&P500 would decline to 3,800 in the fourth quarter of this year.
Current economic forces are pulling stocks in different directions. While the flood of money into the economy is pushing stock prices higher, a widely anticipated increase in interest rates is pulling stock prices down.
In the early part of this year, the forces pulling stocks lower have won this tug of war. If monetary policy were to shift from expansion to contraction, as it did in 2008, it would lead to serious problems for both the stock market and the economy.