This copy is for your personal, non-commercial use only. Distribution and use of this material are governed by our Subscriber Agreement and by copyright law. For non-personal use or to order multiple copies, please contact The Epoch Times Reprints.
The housing market in the United States is practically in a state of collapse. In April, the sales of new homes fell by 16 percent. At the same time, prices soared to a new staggering record of $570,000, way above the pre-pandemic level of around $390,000. That’s an increase of over 46 percent in just two years! How did that happen?
It all relates to the massive role the Federal Reserve and the U.S. government took in the economy during the pandemic. As explained in my previous article, the Fed took an unprecedented role in the U.S. financial markets during the pandemic. The U.S. government issued three rounds of stimulus checks during the pandemic: $1,200 in April 2020, $600 in December 2020/January 2021 and $1,400 in March 2021. These actions led to an inflation shock and an asset market “mania,“ but in addition, they fed the real estate market ”bubble“ by lowering the price of lending and by (artificially) upholding consumer spending. Now, interest rates have risen, and will rise further, and the housing market is ”cratering.”
This is a clear recessionary signal, as the housing market accounts for over 17 percent of the U.S. GDP (2020 figures). What are the other recession indicators saying?
We warned of the impending U.S. recession in March 2019. We provided an estimate on the timing in our forecasting report (Q-Review) in June 2019, where we wrote: “If we assume that China will not turn stimulus back up, and the Fed will not pre-emptively cut interest rates, recession is likely to start in the Eurozone in Q4 this year. The US would follow in Q1 2020.”
Our forecast proved rather accurate as the Eurozone fell into a recession in Q4 2019, while the U.S. economic activity slowed notably during January 2020, before the impact of the coronavirus started to “bite” in February/March.
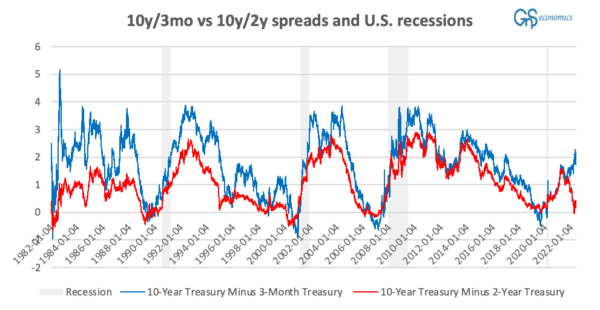
We based our analysis on the 10-year/3-month, i.e., the difference between the 10-year U.S. Treasury bond and the 3-month U.S. Treasury Bill (or the “spread”). Academic literature had found it to be a very reliable recession predictor with, historically, recession following 9-17 months after the inversion. In 2019, the inversion occurred in March 2019. Where is the 10-year/3-month spread now?
It is actually nowhere near inversion (see the Figure). However, what has inverted, briefly, is the spread of yields of U.S. 10- and 2-year Treasury Bonds. It is another rather frequently used recession indicator and its inversion led to a lively debate on the timing of the recession. How come the spreads, which have followed each other in lockstep through history, are now suddenly showing such a divergence?
A figure presenting the difference, or "spread," of the yield of 10-year U.S. Treasury Bond minus the yield of the 3-month U.S. Treasury Bill, and the 10-year minus 2-year U.S. Treasury Bonds GnS Economics, St. Louis Fed
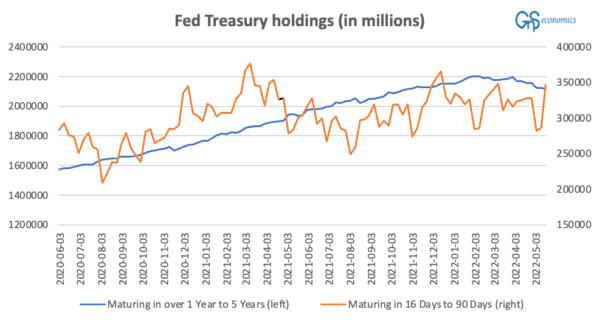
The answer may lie in the bond purchases of the Fed. While the Fed has “tapered,” i.e., it has stopped increasing its holdings of U.S. Treasuries, bonds do mature and as long as the Fed is not doing quantitative tightening (QT), it buys back all the bond holdings that mature. However, the Fed may alter the distribution of the bonds it holds, meaning that it may buy bonds with other maturities to replace those that have matured.
The following figure shows the Treasury holdings of the Fed with maturities from 1 to 5 years and from 16 to 90 days. What it shows is that, while the holdings of Treasuries with 16- to 90-day maturities have risen, holdings of Treasuries with a maturity from 1 to 5 years have fallen.
A figure presenting the Fed holdings of U.S. Treasuries with 1- to 5-year and 16- to 90-day maturities in millions of U.S. dollars. GnS Economics, St. Louis Fed
When the price of a bond declines, that is, when there’s less demand for it, its yield rises. Now, if we assume that the Fed has replaced the matured 2 -year Treasury bonds with 3-month Treasury Bills, it would have pushed the price (yields) of 2 -year Treasuries down (up) and the price (yield) of 3-month Treasuries up (down). This would have caused the 10-year/3-month spread to increase and that of the 10-year/2-year spread to decline.
We naturally cannot be certain, based on the data available, that is what has happened, but it’s possible or even likely, and it may have even been deliberate. When the Fed starts to tighten, it most likely wants to avoid causing any strong recessionary signals. This is why they may have increased their holdings of 3-month Treasuries to keep their yield down to avoid the inversion of the 10-year/3-month spread. In any case, because of the quantitative easing (QE) and QT, the whole bond market is a mess, and all signals from it should be interpreted with a heavy grain of salt.
Data on the real economy, on the other hand, points to impending contraction of the economy.
The manufacturing index of the Richmond Fed declined to -9, the lowest level since June 2020. The New York Fed manufacturing index crashed 36 points to -11.6, which was a second negative reading in three months. Outlook of the manufacturing firms for the upcoming six-month period also dimmed in both surveys and they are now near pandemic-era lows. The Atlanta Fed “nowcast“ for Q2 has been low and has recently declined to forecasting just a 1.8 percent growth (YoY) for Q2. CEO confidence is also falling fast in the United States.
Now the Fed seems determined to tighten their monetary policy, that is, to continue to raise rates and enact QT in June. Both will eat into the housing market, consumer demand, and financial markets.
Uncertainties concerning the inflation outlook, supply chain issues, and geopolitical risks also hang heavily over the skies of the global economy. This is reflected, e.g., in the crashing new exports orders of the manufacturing sector in the main export hubs of the world: China, Germany, and Japan.
It is thus really difficult to forecast anything other than the onset of a recession during the latter part of this year, if not here already.
Tuomas Malinen is CEO and chief economist at GnS Economics, a Helsinki-based macroeconomic consultancy, and an associate professor of economics. He studied economic growth and economic crises for 10 years. In his newsletter (MTMalinen.Substack.com), Malinen deals with forecasting and how to prepare for the recession and approaching crisis.