One of the most important components of ranking California cities is waiting for some of them to provide their annual comprehensive financial reports (ACFRs).
I want to thank the city of San Joaquin for responding to my requests. Also, the city of Amador City provided financial records from which I had to prepare the unrestricted net position.
By obtaining the ACFRs and reviewing the Basic Financial Statements, take the unrestricted net position (UNP) from the statement of net position (balance sheet) and divide it by the city’s population to calculate the per capita. Using this simple temperature gauge, let’s see how the cities in the region compare.
While most of the cities stayed in place for the year 2020, moving six places or less, 11 moved seven places or more and deserved a closer look. And remember, the COVID-19 lockdown occurred in the final four months of that fiscal year, which contributed to the areas combined unrestricted net deficit increasing by $444 million.


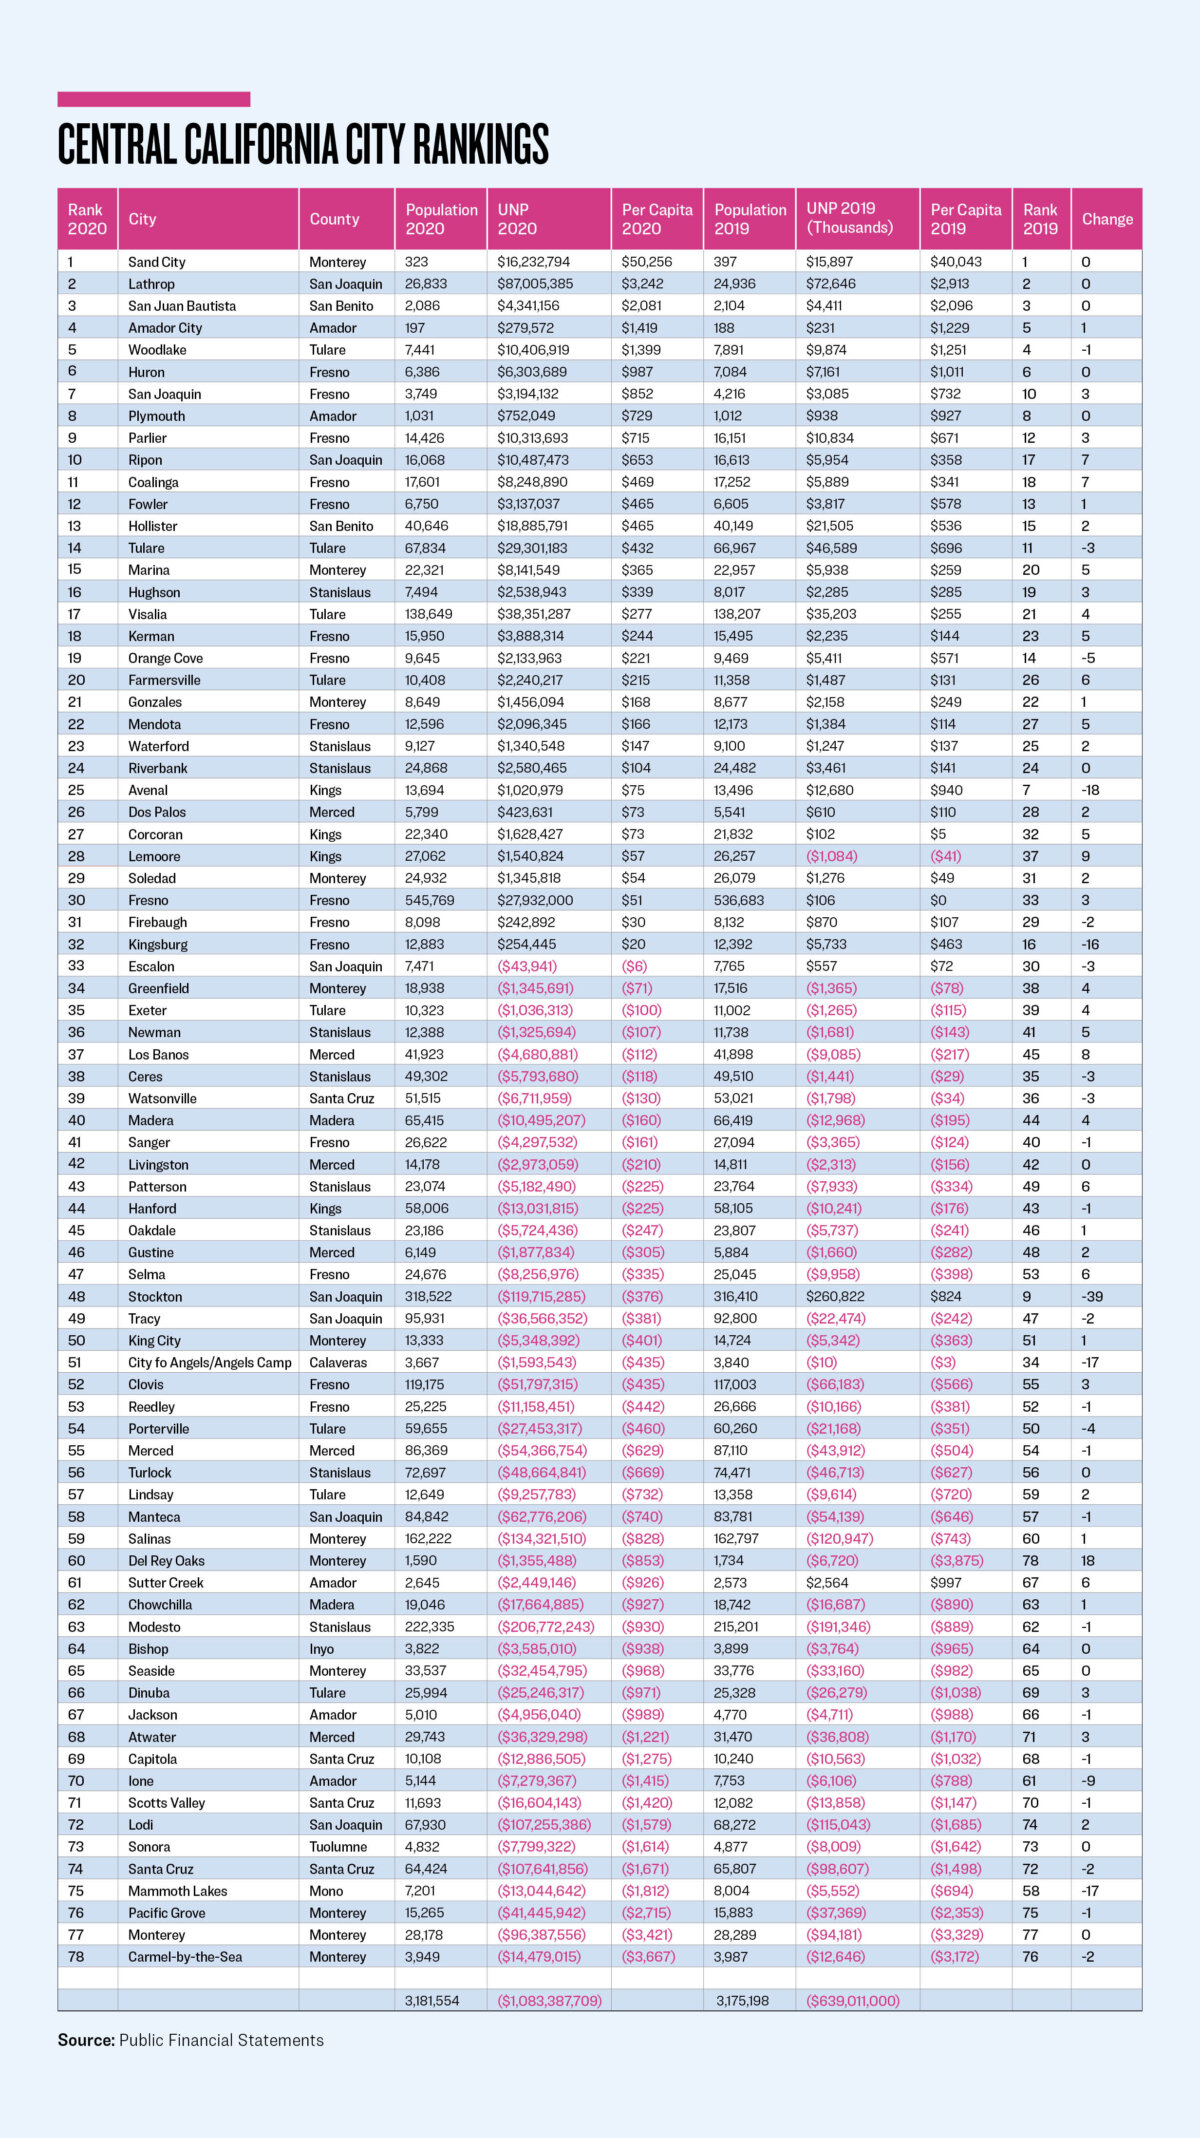
The biggest upward mover was Del Rey Oaks, jumping from last place in 2019, it moved up 18 positions. It had revenues in excess of expenditures of $14.6 million, with Community Development grants of $9.6 million and a release of obligation due to the Fort Ord Reuse Authority of $4.4 million being the two major contributors. This was related to the South Boundary Roadway project dissolution originally initiated by the U.S. Army and dominates the footnote disclosures in the ACFR.
It moved $14.4 million into restricted assets and reduced its net investment in capital assets by $5.2 million, which explains, sort of, the improvement in its unrestricted net position by $5.4 million. I say somewhat, as reducing the $4.5 million FORA liability should have increased the net investment in capital assets. This category on the statement of net assets needs a supporting schedule in the footnotes to assist the readers of the true results of these financial activities.
Los Banos, where my family enjoys eating at an historic Mexican restaurant when we drive up or down the state, had revenues in excess of expenditures of $11 million. It transferred $7.3 million into restricted assets—explaining the bulk of the $4.4 million improvement in its unrestricted net deficit, moving it up eight places.
Ripon had revenues in excess of expenditures of $4.5 million. It transferred $6.4 million into restricted assets. It increased its unrestricted net position for the beginning of the year by $6.4 million. The net investment in capital assets is not provided and there appears to be no fixed assets—the joys of using the “modified cash basis.” There was no explanation for the prior-year adjustment in the footnotes accompanying the ACFR, and page three of the disclosures did not reconcile to the statement of position ending amount for the unrestricted net position. Consequently, it is difficult to determine how it increased by $4.5 million, moving it up seven places.
Coalinga had revenues in excess of expenditures of $5.5 million, allocated $3.4 million into net investment in capital assets, explaining the bulk of its $2.4 million improvement to its unrestricted net position. It moved up seven positions.
Avenal had expenditures in excess of revenues of $3,709,586. It transferred $348,678 into restricted assets. And it reduced its net investment in capital assets by $1,398,899, thanks mainly to depreciation expense of $1,447,026. Combined, the unrestricted net position dropped by $2,659,365. It dropped 18 places.
With that, watching what your city councils are or aren’t doing and whether more scrutiny needs to be paid to the financial reporting may be warranted. Does your city have a finance committee with qualified volunteers? Does it have an audit committee? It would seem that having more eyes to demand prompter reporting and better accuracy is something that should be considered by every city council.