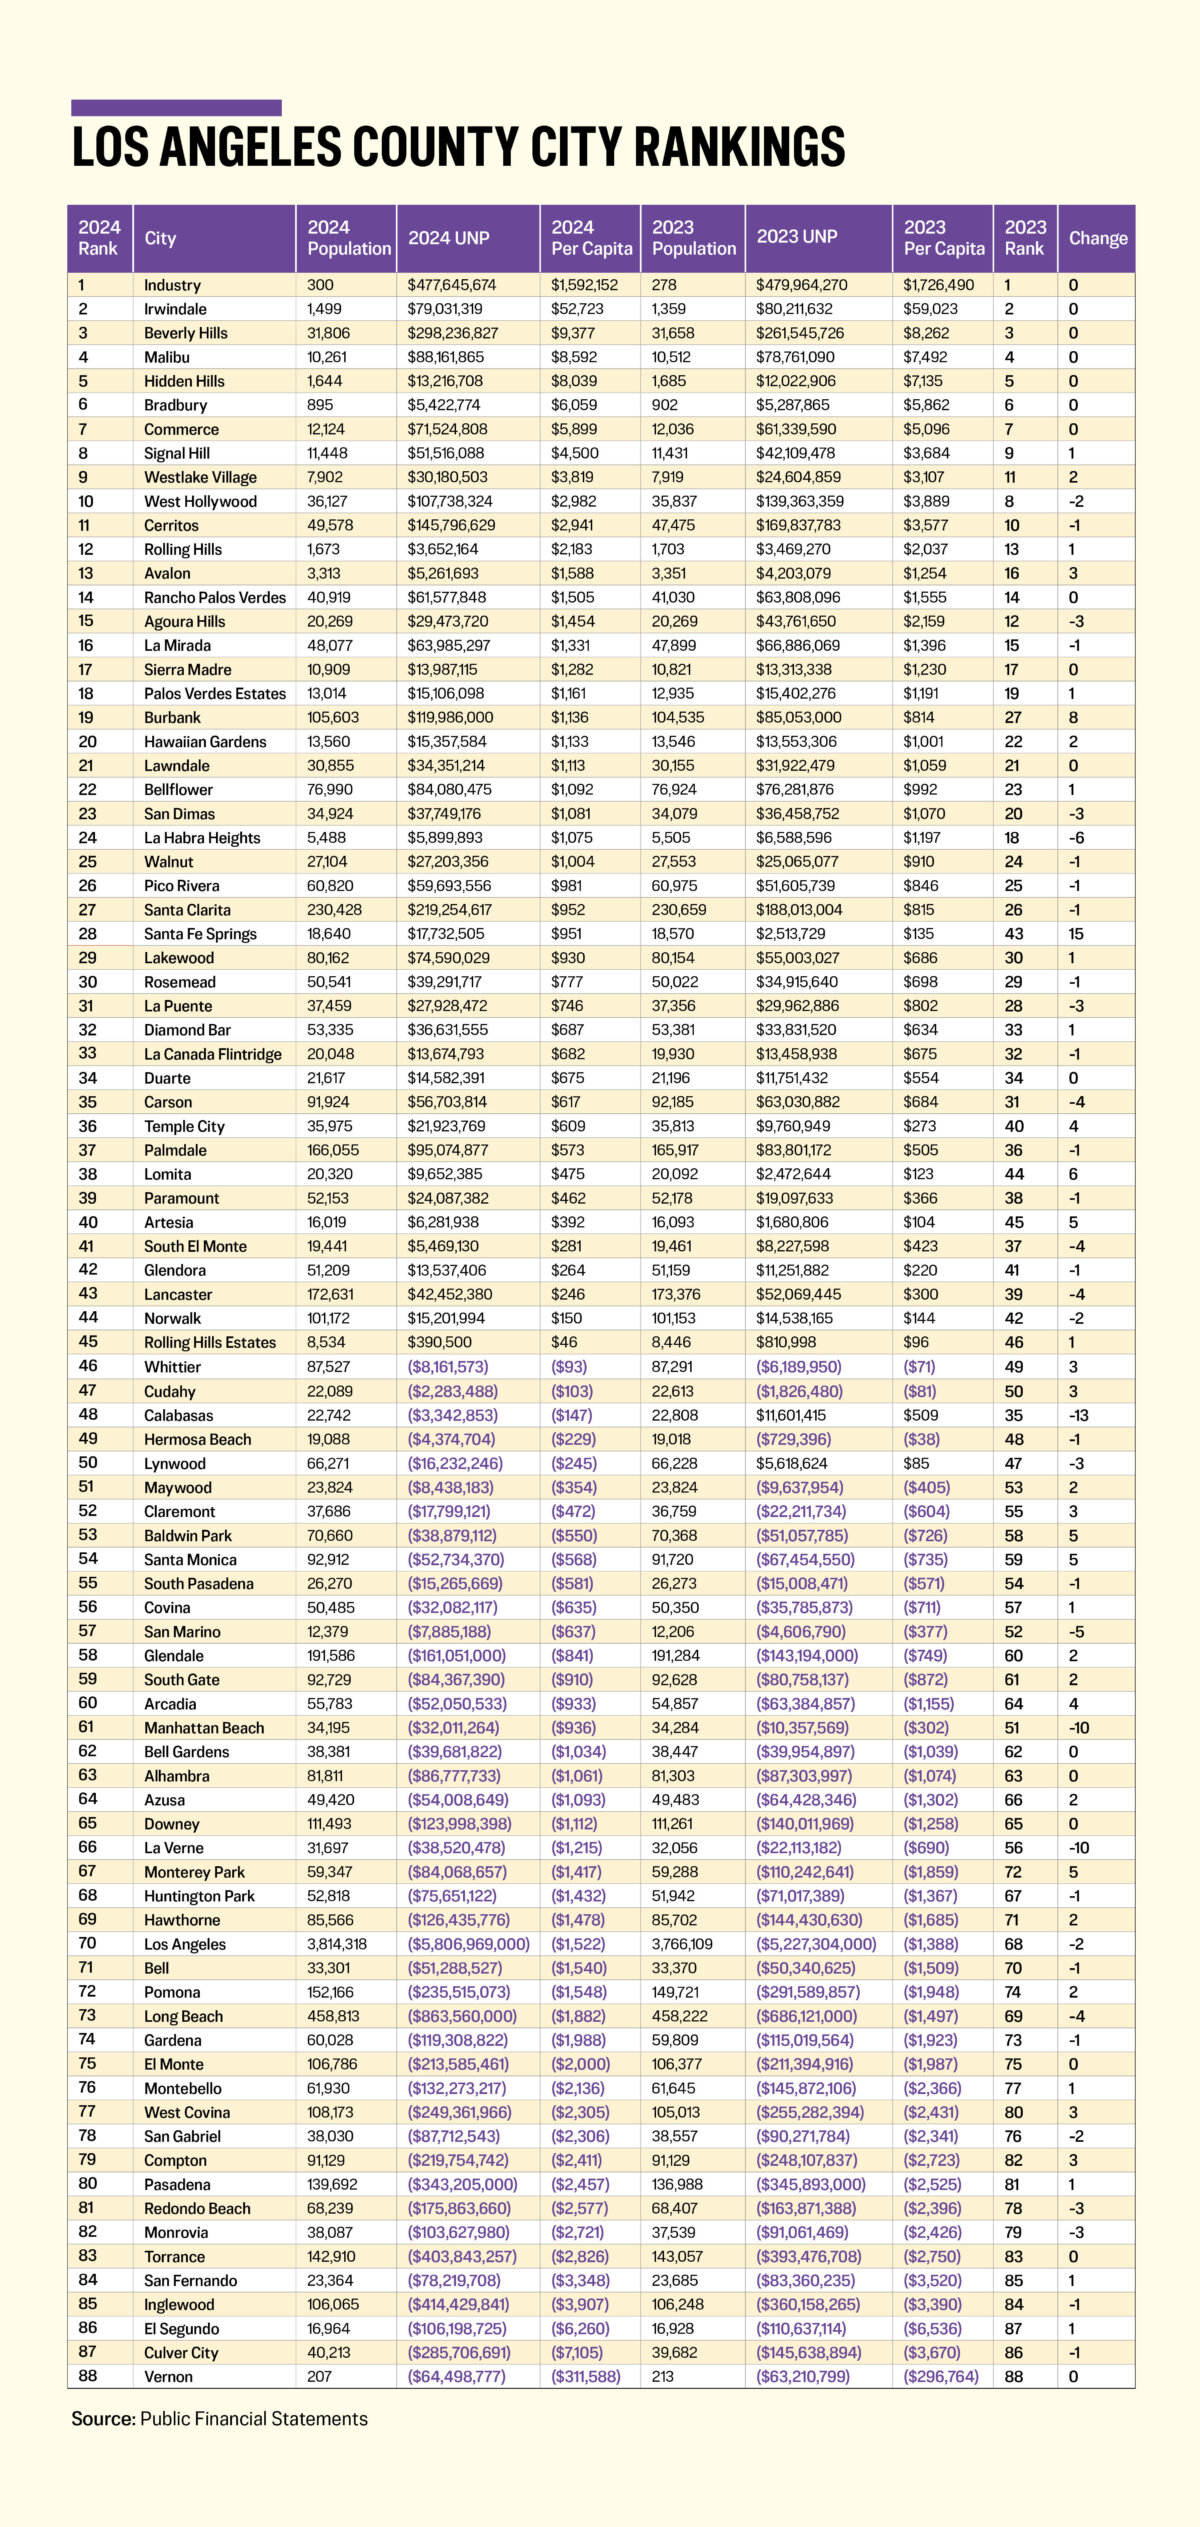
The top 18 ranked cities found themselves maintaining their positions, as did the 15 bottom cities. Reviewing the graph below, let’s see what these seven cities did.
The first step in the process is to obtain the annual comprehensive financial reports (ACFRs) from each city. This is easier said than done. Thirty-four cities completed their audit field work before the due date of December 31, 2024. Another 33 met the secondary deadline of March 31, 2025. That leaves 22 cities delinquent in performing a simple audit function and should be an indicator that something is amiss in the finance department.

The states of Florida, Texas and Utah have laws requiring penalties for lateness. California recently approved one last year with Senate Bill 595 (Choi). Let’s hope that municipalities get the hint that many of us actually read their ACFRs and review numerous components to evaluate their overall financial health.
The second step is to look at the basic financial statements and find one amount in the statement of net position labeled “Unrestricted” for “Governmental Activities.”
The third step is to divide this “unrestricted net position” (UNP) by the population of the city to arrive at a per capita.
The fourth step is to rank the per capitas and review the results. If you reside in the county seat, the city of Los Angeles, you’ll find its negative per capita increased by $579.7 million. This means that if the city wanted to liquidate, every man, woman and child residing within its borders would have to assist by chipping in $1,522 each. A family of four would have to donate $6,088. Don’t fret, there are 18 other cities with higher negative per capitas. And with Los Angeles’ mayoral candidates receiving national attention, plenty is being stated about this city’s dire fiscal situation.
The famous author, Charles Dickens, wrote something obvious about finances in his novel “David Copperfield”:
“Annual income twenty pounds, annual expenditure nineteen nineteen and six, result happiness. Annual income twenty pounds, annual expenditure twenty pounds ought and six, result misery.”
Bottom line? Don’t spend during the year more than your annual income.
Once again, Santa Fe Springs had revenues in excess of expenditures, and this year it was $30.4 million. This is $8 million lower than the previous year but explains its rapid movement up the rankings. It transferred $6 million into restricted assets and allocated $9.2 million to net investment in capital assets. Combined, this caused its unrestricted net position to grow from $2.6 million to $17.8 million, moving it up 15 places.
Lomita had revenues in excess of expenditures of $4.5 million and transferred $2.7 million out of its restricted assets, explaining the $7.2 million improvement in its unrestricted net position and moving it up six positions.
La Habra Heights had revenues in excess of expenditures of $2.2 million, putting nearly all of it, $1.9 million, into restricted assets. It also allocated $1 million towards its net investment in capital assets, reducing its unrestricted net position by $0.7 million, and dropping it six places.
Although the combined unrestricted net deficit of Los Angeles County’s cities increased by $716.2 million, roughly six out of every ten cities improved their fiscal standing during 2024. If your city was one of them, thank your city council and finance director for moving it in the right direction.
The June 30, 2025, ACFRs should have been available months ago. Let’s hope the city of Compton catches up and we won’t have to wait a year from now to provide the 2025 rankings.