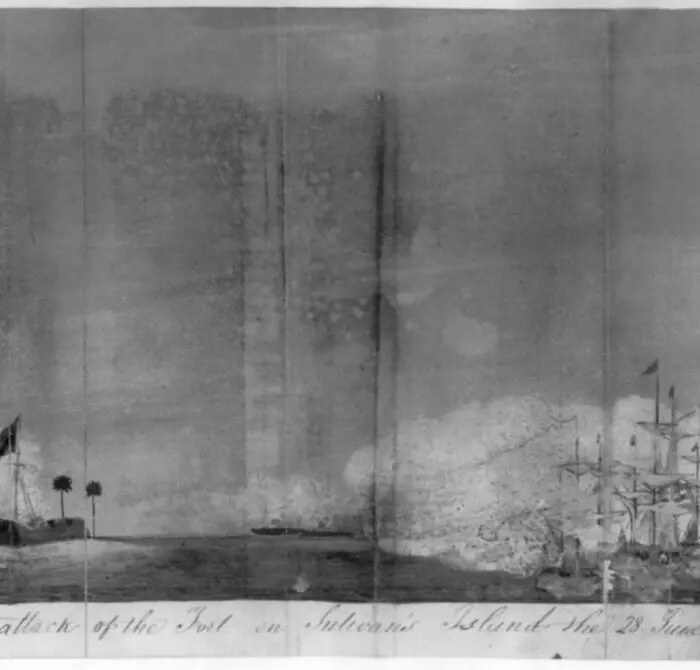
The United States has transformed from a collection of 13 eastern colonies into a transcontinental nation spanning 50 states, one district, and five major territories—a geographic expansion forged through land purchases and war treaties.
America’s two-and-a-half-century evolution includes not only geographic growth, but also transformations in population, family structures, wages, the housing market, and health.
Through data and graphics, here is a look at how the country has changed over 250 years.
Changing Face of America
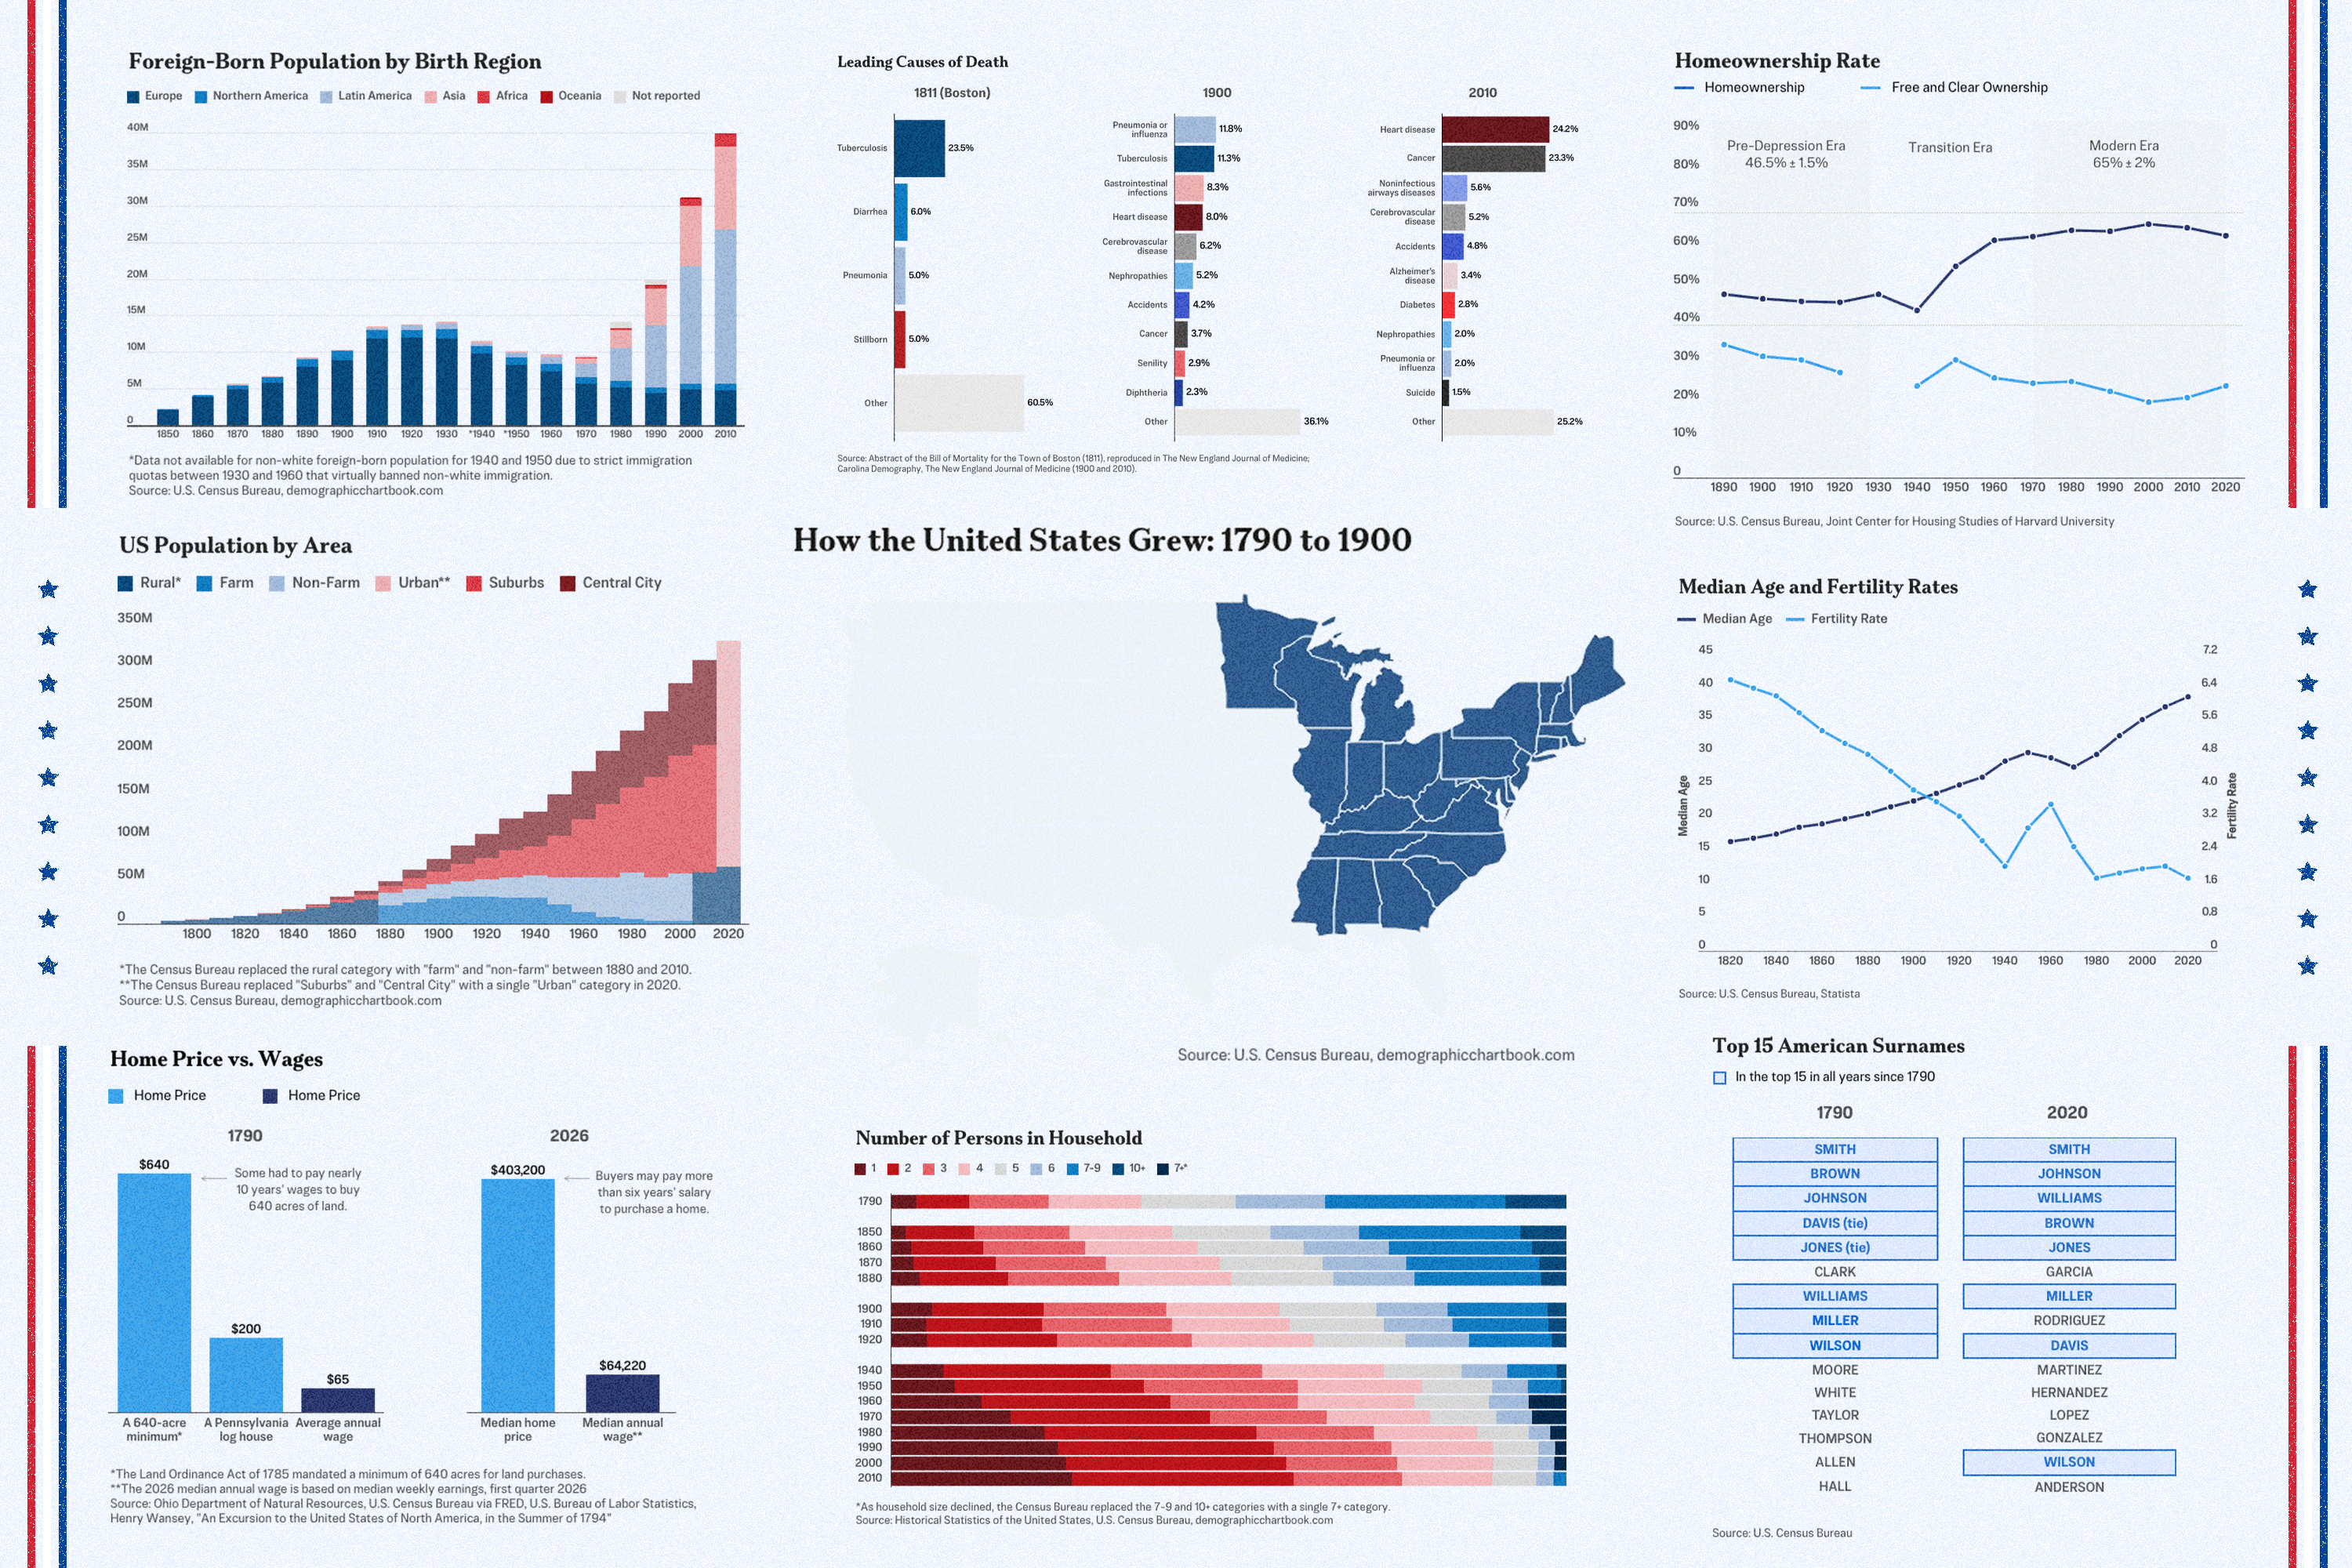
In 1790, 95 percent of Americans resided in rural areas; by 2020, that figure had dropped to 20 percent.
This demographic shift transformed the rural landscape itself. More than 50 percent of rural residents lived on farms prior to 1940, but that share dwindled to a mere 5 percent by 2000.
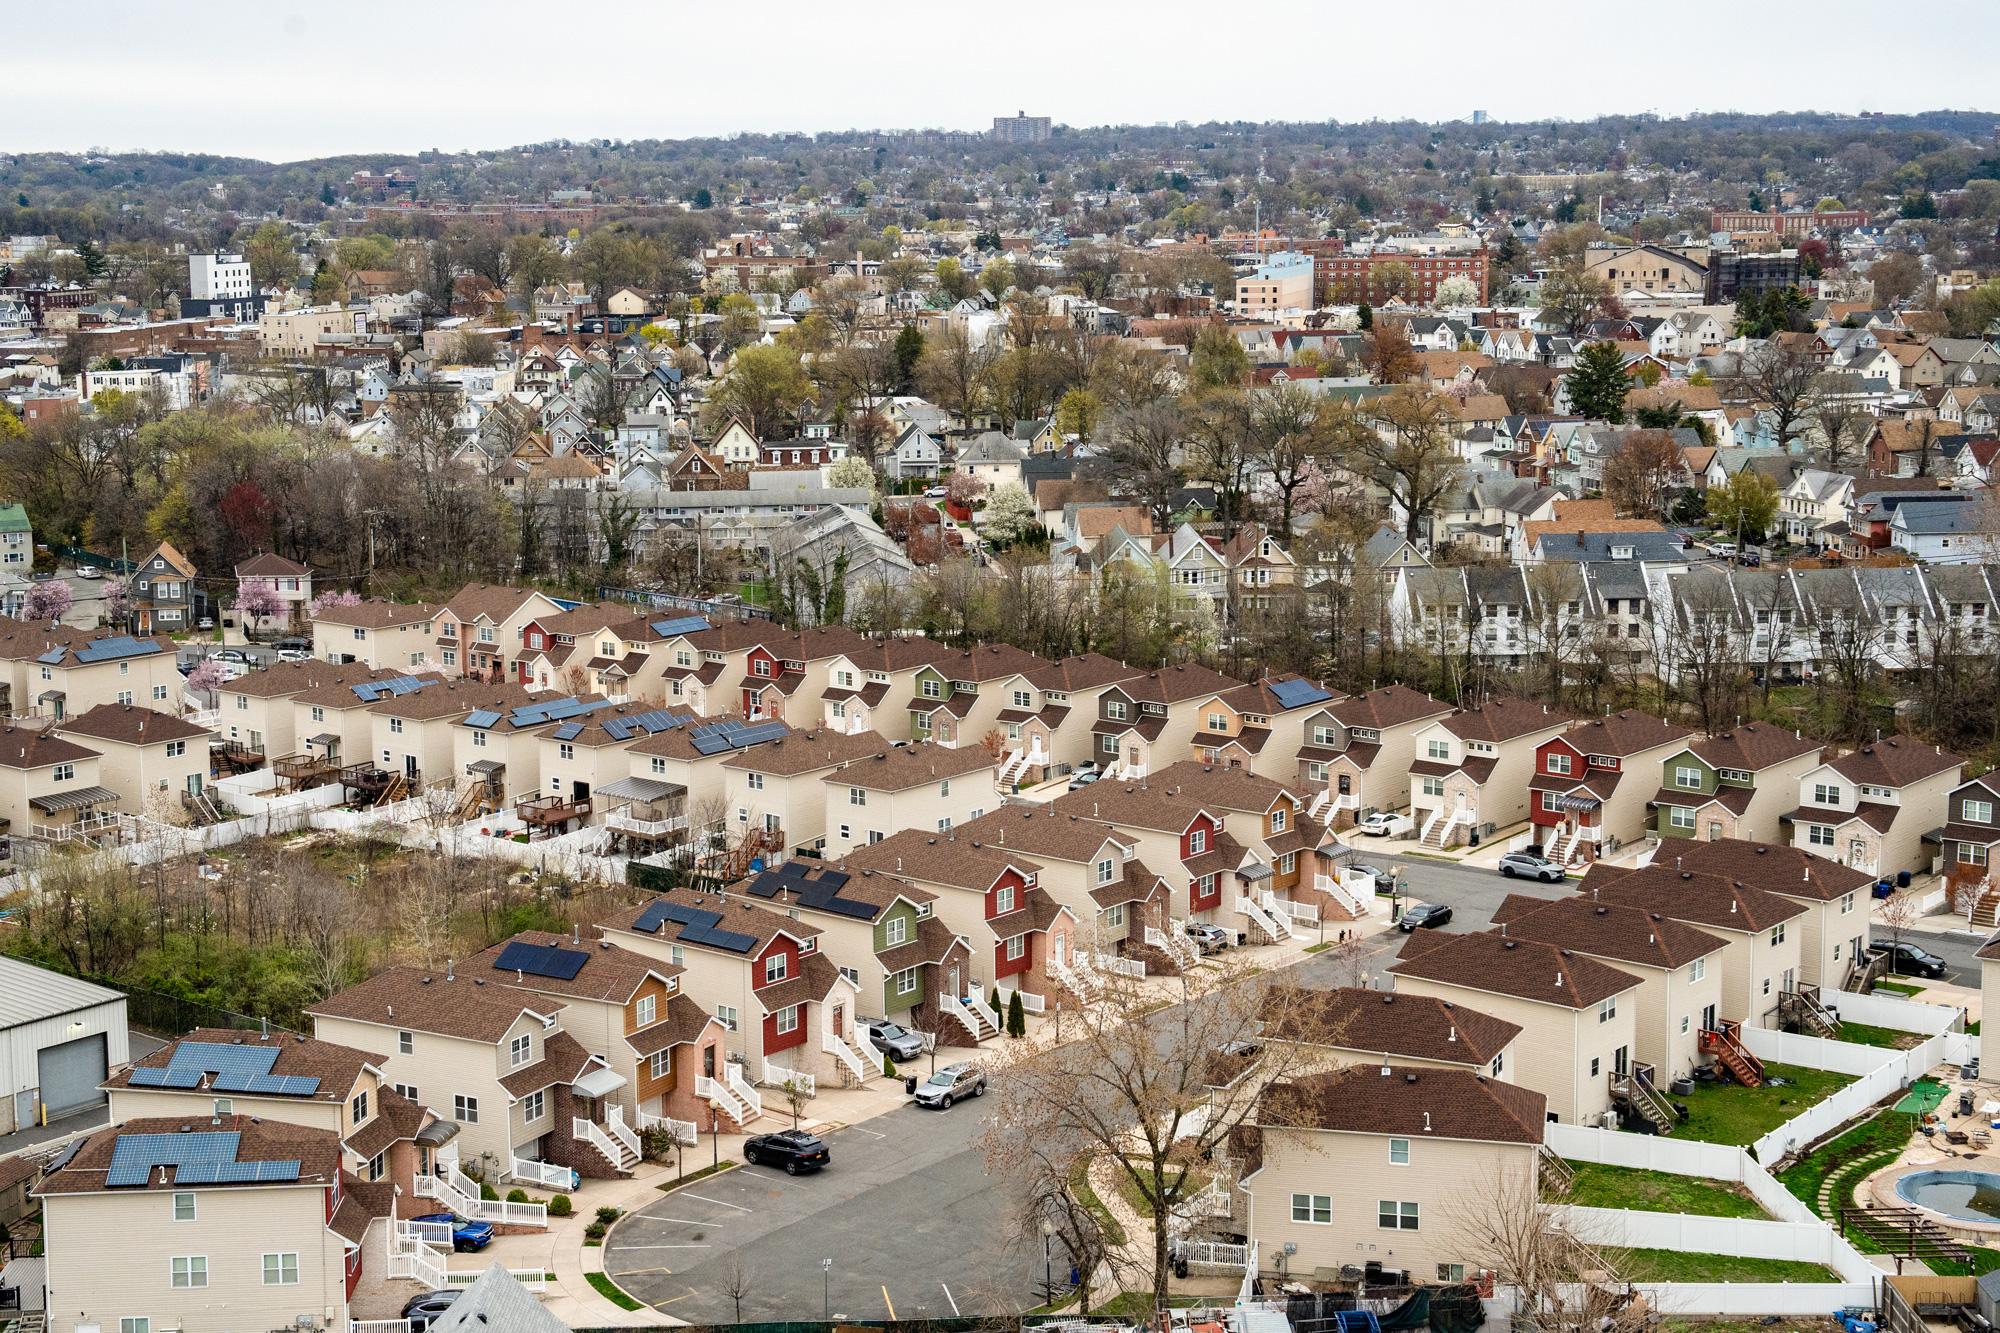
Although the U.S. urban population surged from 5 percent in 1790 to 80 percent in 2020, this growth shifted heavily toward suburban and outlying areas after 1950, leaving central cities with less than half of the total urban population.
While domestic migration altered where Americans lived, shifting global immigration patterns simultaneously refined who made up the nation.
The number of U.S. foreign-born residents grew from 2.2 million in 1850 to 50.2 million in 2024, or from 9 percent of the national population to nearly 15 percent.
Europe supplied the majority of immigrants during a century-long window from 1850 to 1970, though its share dropped from 92 percent to about 62 percent.
The Mexican-born population of the United States multiplied more than 15 times between 1970 and 2010, exploding from fewer than 800,000 to nearly 12 million.
The pivot point of modern immigration was the 1986 Immigration Reform and Control Act, according to a 1999 study from the Organization of American Historians.
The law was “instrumental in transforming Mexican immigration” from a seasonal flow of undocumented workers into settled families across the country, according to the journal.
Spurred by economic instability in Mexico in the late 1980s, migrants “opted to remain abroad, accept the proffered legalization, and settle more permanently into a United States life.”

By 2010, the regional makeup of the foreign-born population was led by Latin America (over 50 percent), followed by Asia (28 percent) and Europe (12 percent).
California, Texas, and Illinois were the leading states of residence for Mexican-born populations.
Despite the global immigration and an 84-fold population increase over 230 years, the most common American last names have remained consistent, according to an April report from the U.S. Census Bureau.
Surnames such as Smith, Johnson, Williams, Brown, Jones, Miller, Davis, and Wilson all placed in the top 15 in both the 1790 and 2020 censuses.
Notably, Asian last names such as Zhang, Liu, and Wang ranked among the fastest-growing surnames between 2010 and 2020, according to the bureau’s data.
Evolution of the American Household
America was young in 1800, with high fertility rates and abundant land. Its population was young, too—roughly 50 percent of the population was 16 years old or younger.
In the 18th century, the average American woman bore at least seven children.
Benjamin Franklin attributed the high fertility rates to the ease of acquiring good farmland.
“So vast is the Territory of North-America, that it will require many Ages to settle fully,” he said in a 1751 essay. “Land being thus plenty ... a labouring man, that understands Husbandry, can in a short Time save Money enough to purchase a Piece of new Land sufficient for a Plantation, whereon he may subsist a Family.”
The American population grew and lived longer. It expanded from from 3.9 million in 1790 to roughly 342.6 million by June 2026, while its median age more than doubled, from 16 to around 39.
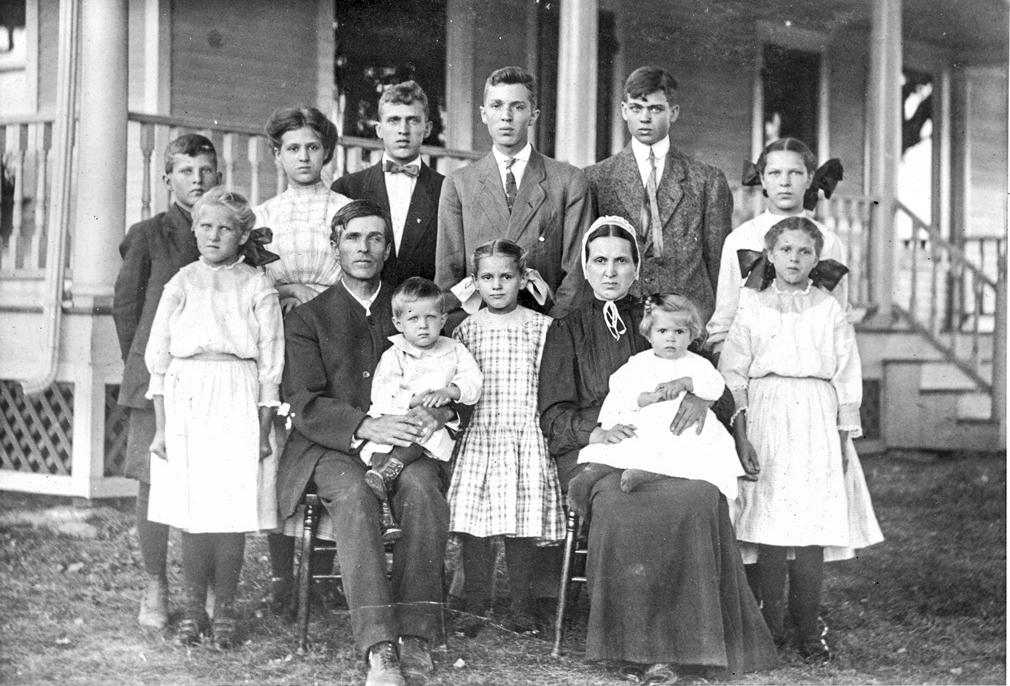
In 1790, large families dominated the landscape, with 36 percent of U.S. households containing seven or more members. Conversely, small households (one to two people) made up just 11.5 percent of the population.

The trend reversed over time. By 2010, large households with seven or more people dwindled to under 2 percent, while small households of one or two individuals surged to a 60 percent majority.
Despite the shrinking size of the American family, the cultural ideal of a stable, self-sufficient home remained a cornerstone of national policy.
“A family that owns its home takes pride in it, maintains it better, gets more pleasure out of it, and has a more wholesome, healthful, and happy atmosphere in which to bring up children,” President Herbert Hoover said in a 1931 handbook for homebuyers.
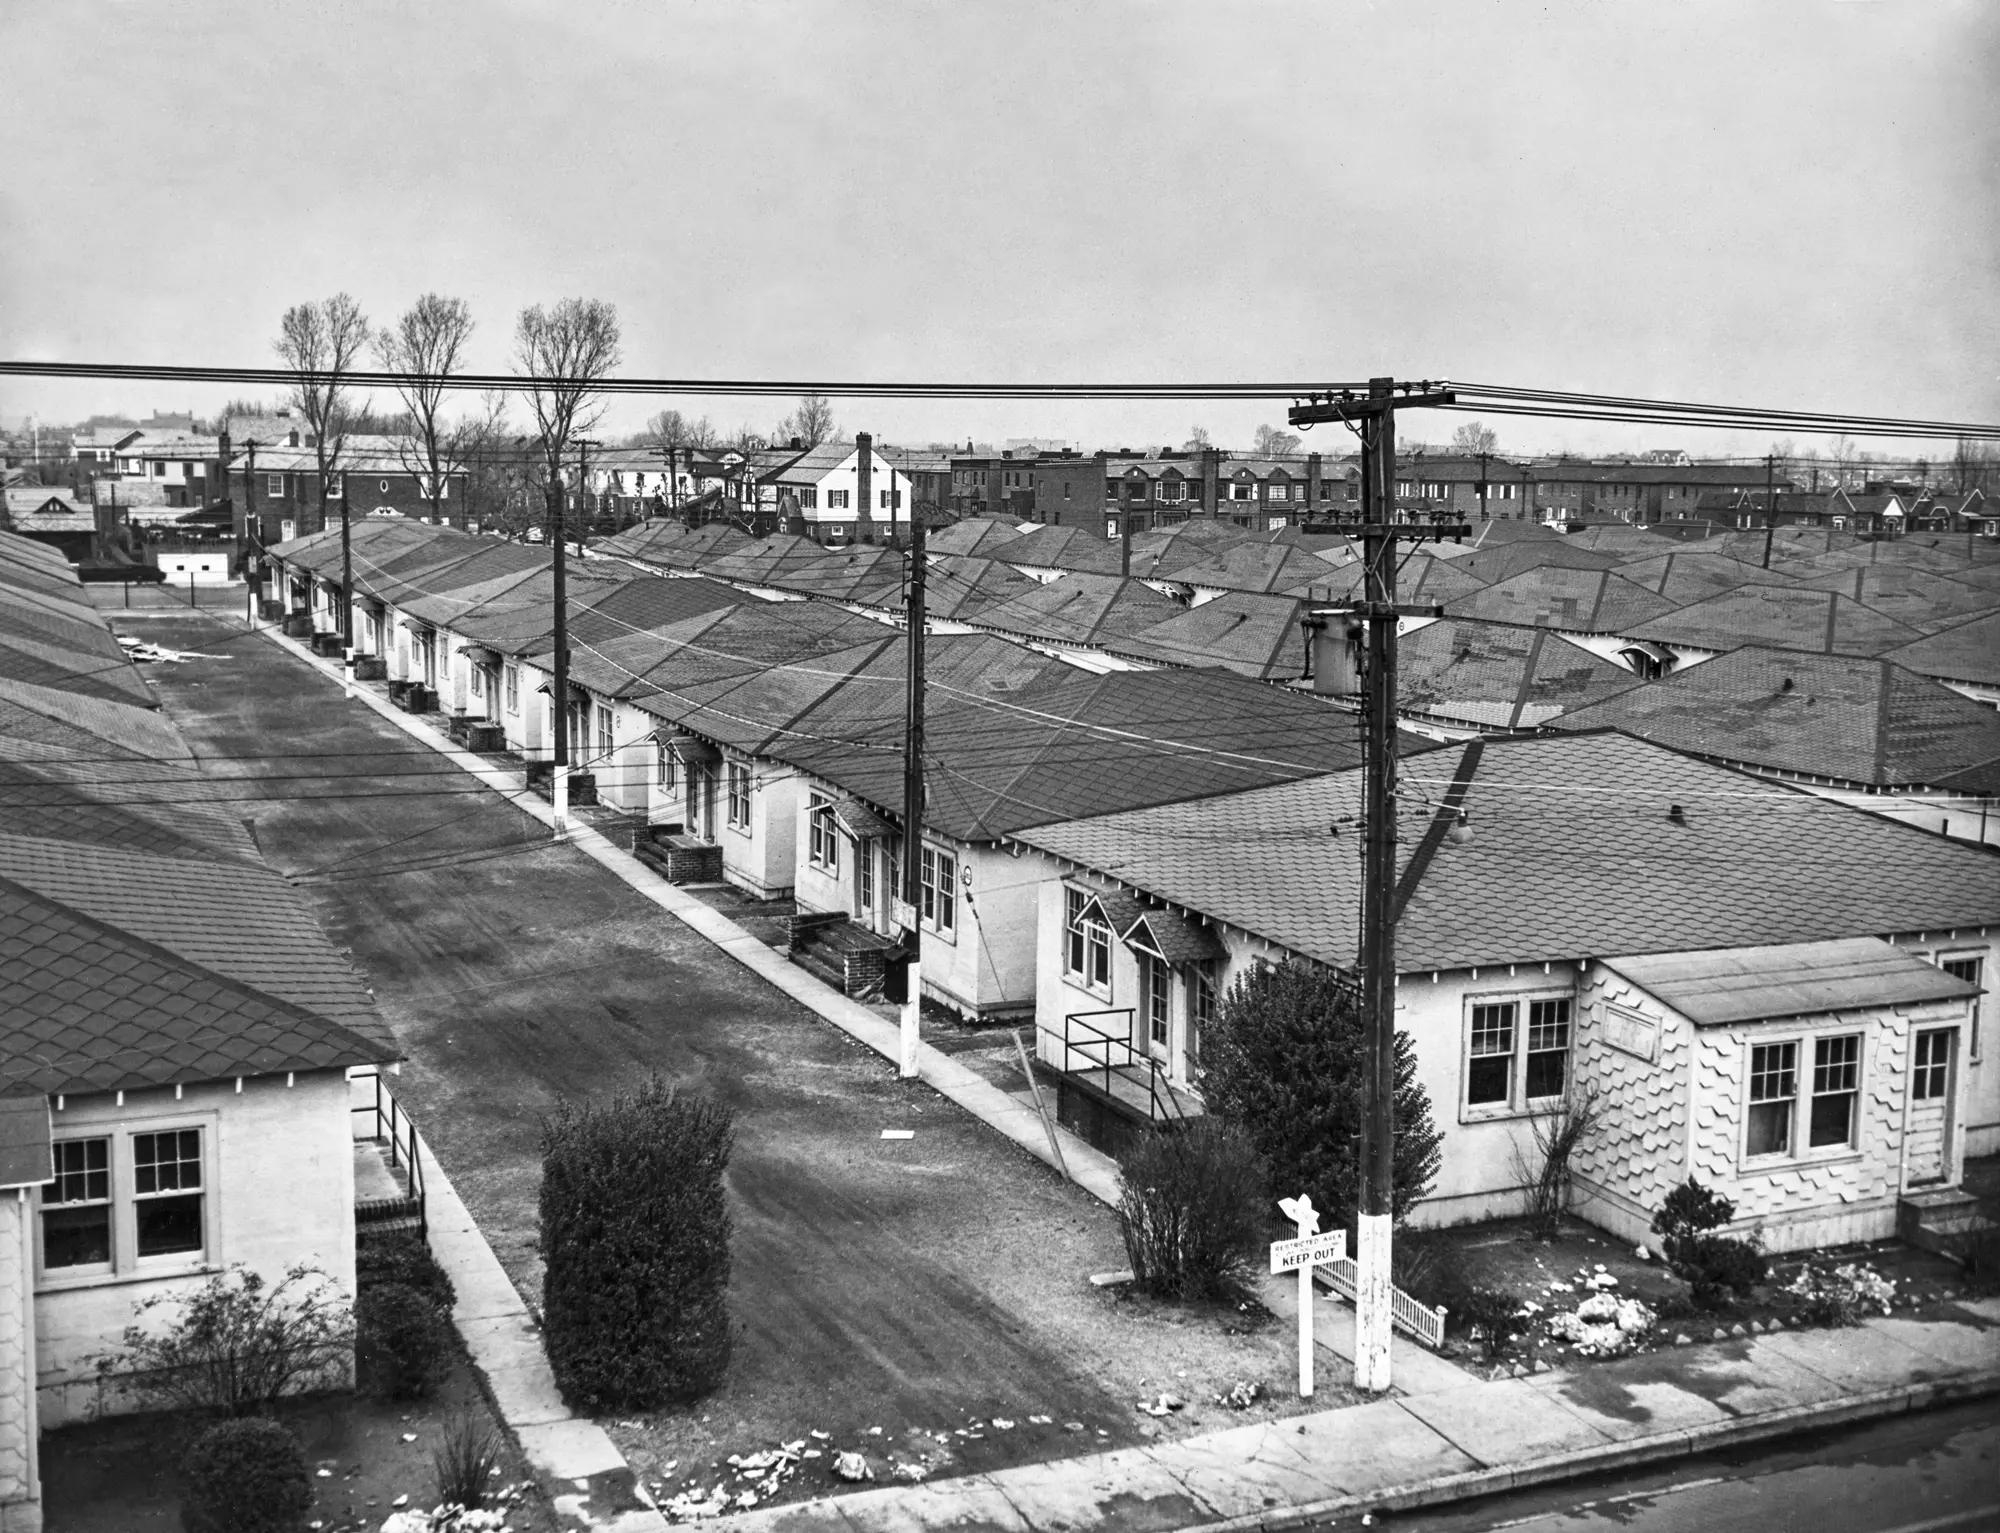
The federal government implemented standardized housing, city plans, and building codes to increase homeownership beginning in the 1920s.
By 1930, the federal government introduced long-term, fixed-rate mortgages that self-amortized over 20 years—later expanded to 30 years.
But before 1940, homeownership never exceeded 50 percent.


Then began, in 1945, the economic miracle of the postwar era—a “golden era” for the American family.
Homeownership climbed steadily through this era and reached almost 65 percent by the end of the 1960s, according to the Joint Center for Housing Studies of Harvard University. Since then, it has stayed relatively stable, rising to just over 66 percent in 2000 and dropping to 63 percent in 2020.
In the pre-Depression era, most homeowners were mortgage free. Those who carried mortgages often had short-term contracts of around one to five years, with large downpayments of more than 50 percent. Many homeowners turned to second mortgages as a source for downpayments.
The modern, long-term mortgage introduced during the 1930s to combat a foreclosure crisis during the Great Depression enabled widespread middle-class homeownership.
At the same time, it had the effect of reducing the number of homeowners who owned their homes outright. Less than 19 percent of Americans owned their homes free and clear in 2000, but the number is rising, according to Census Bureau data. Almost a quarter of Americans owned their homes outright in 2020.
Cost of the American Dream
The U.S. government sold land at just $1 an acre in the 1790s. But there was a catch.
Congress needed a way to raise funds to support the fledgling government after the costly American Revolutionary War. The Land Ordinance Act of 1785 raised those funds through land sales. The acreage was cheap. However, buyers had to purchase a minimum of 640 acres and had to pay in cash or military land warrants.
Before 1800, the average wage for laborers—such as hod-carriers, mortar-mixers, diggers, and choppers—was $65 a year, “with food and, perhaps, lodging,” estimated historian John Bach McMaster in his book “A History of the People of the United States, From the Revolution to the Civil War.”
Wages varied by occupation and state. Women at a cotton factory in New York were paid around $104, Henry Wansey reported in his traveling journal, published in 1796 as “An excursion to the United States of North America, in the summer of 1794.” Salaries of seamen were from $240 to $288.
Clergy’s salaries were higher. A Connecticut clergyman could earn 100 pounds—about $475 in 1794, according to Wansey’s journal.
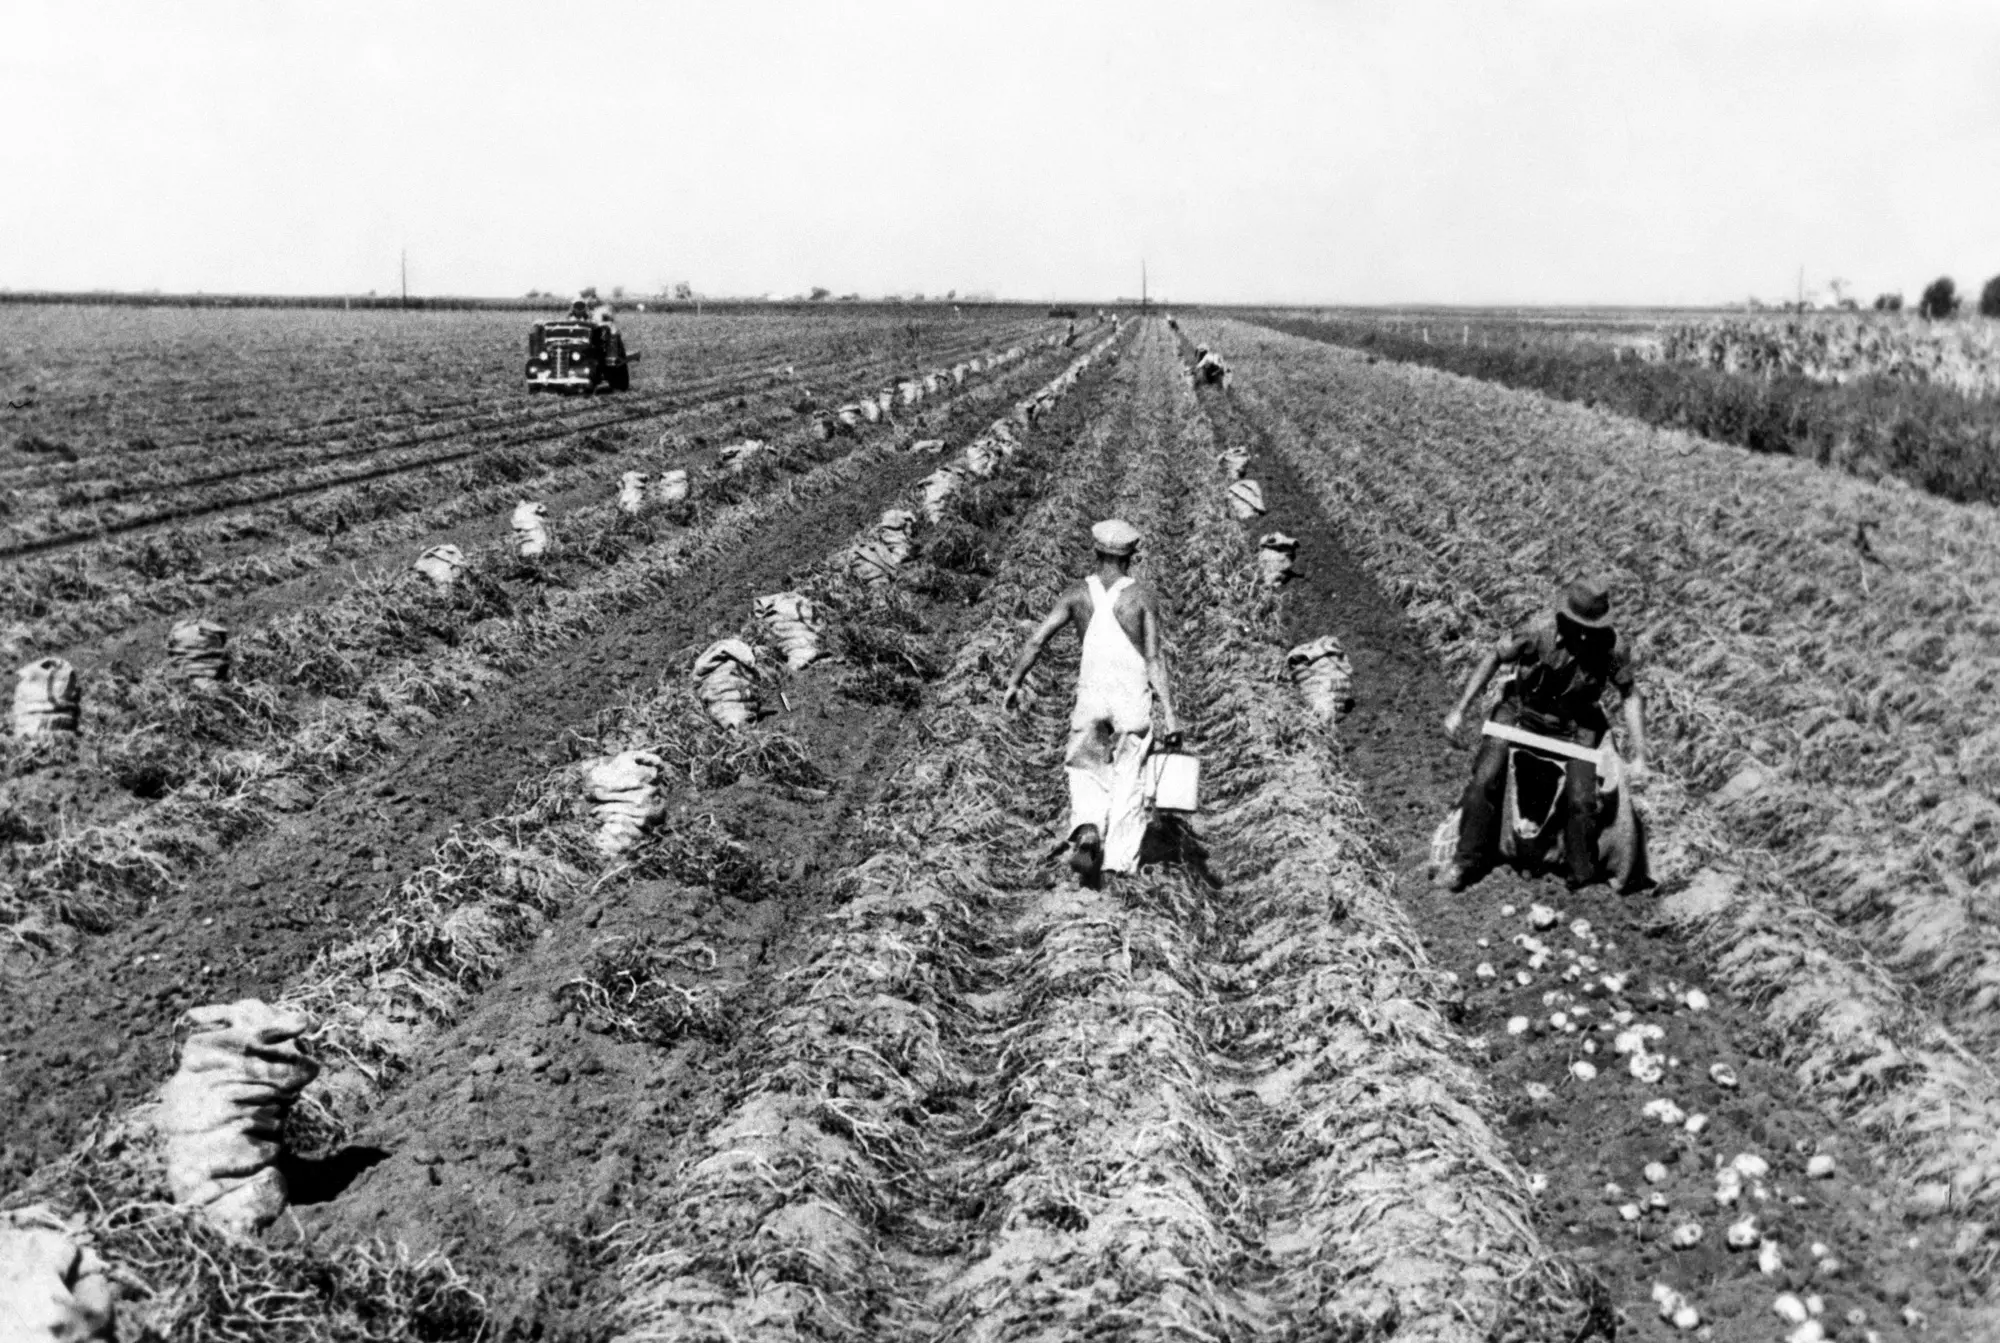
Before 1880, the American workforce was rooted in agriculture. Nearly 30 percent of working adults aged 16 and older were farmers, and an additional 20 percent or more worked as laborers.
By 2000, the number of farm-related workers had dropped to less than 1 percent of the workforce. Instead, professional roles grew to command over 20 percent of American jobs, followed closely by office and administrative occupations at more than 15 percent.
No matter how much the job market changed, the difficulty of translating that income into property ownership has remained a permanent financial hurdle.
While a buyer in the 1790s might have paid almost 10 years wages’ for land, a modern buyer may pay over six years’ salary for a home.
A closer look at the 1790s housing market reveals that while a basic roof was within reach for some, luxury estates demanded an astronomical premium.
A log house in Hamburg, Pennsylvania—with four rooms on a floor, including doors, windows, wainscoting, and locks—cost roughly $200, Wansey observed in his travels.

A New York villa on 80 acres of improved land was listed for around $19,000 in 1794, according to Wansey.
That was a fortune compared to laborers’ wages.
Then as now, the steep premium on New York real estate also extended to the rental market. “House rent is very dear,” Wansey said in 1794 from New York City. “One hundred and fifty pounds sterling is a common rent for storekeepers and tradesmen to give.”
That yearly rent was equivalent to more than $600 in 1794, or around $18,000 today.
Causes of Death
In 1811, tuberculosis (23.5 percent), diarrhea (6 percent), pneumonia (5 percent), and stillbirths (5 percent) dominated the causes of mortality among 942 deceased Boston residents, according to an abstract reprinted in the New England Journal of Medicine in 2012.
Teething, worms, and drinking cold water were also found to kill, according to the study.
In the early 20th century, tuberculosis was still a leading cause of death in the United States, along with pneumonia and influenza.
By 2010, influenza remained on the list but heart disease, cancer, and other chronic conditions assumed more dominant roles.
Circulatory diseases accounted for the largest number of excess U.S. deaths—the number of deaths over the estimated number based on historical trends—from 1999 to 2022, according to a study of more than 63.5 million deaths published in May in JAMA Network Open. The nation’s death rate fell in 2025 to its lowest point on record, according to CDC data. The leading causes of death in 2025 were heart disease, cancer, and unintentional injuries.
Over two-and-a-half centuries, the American population has lived longer.
In the late 1700s, the life expectancy was around 35 to 40 years old, according to historical estimates. Today, the average American life expectancy is about 79 years, according to the Centers for Disease Control and Prevention (CDC).
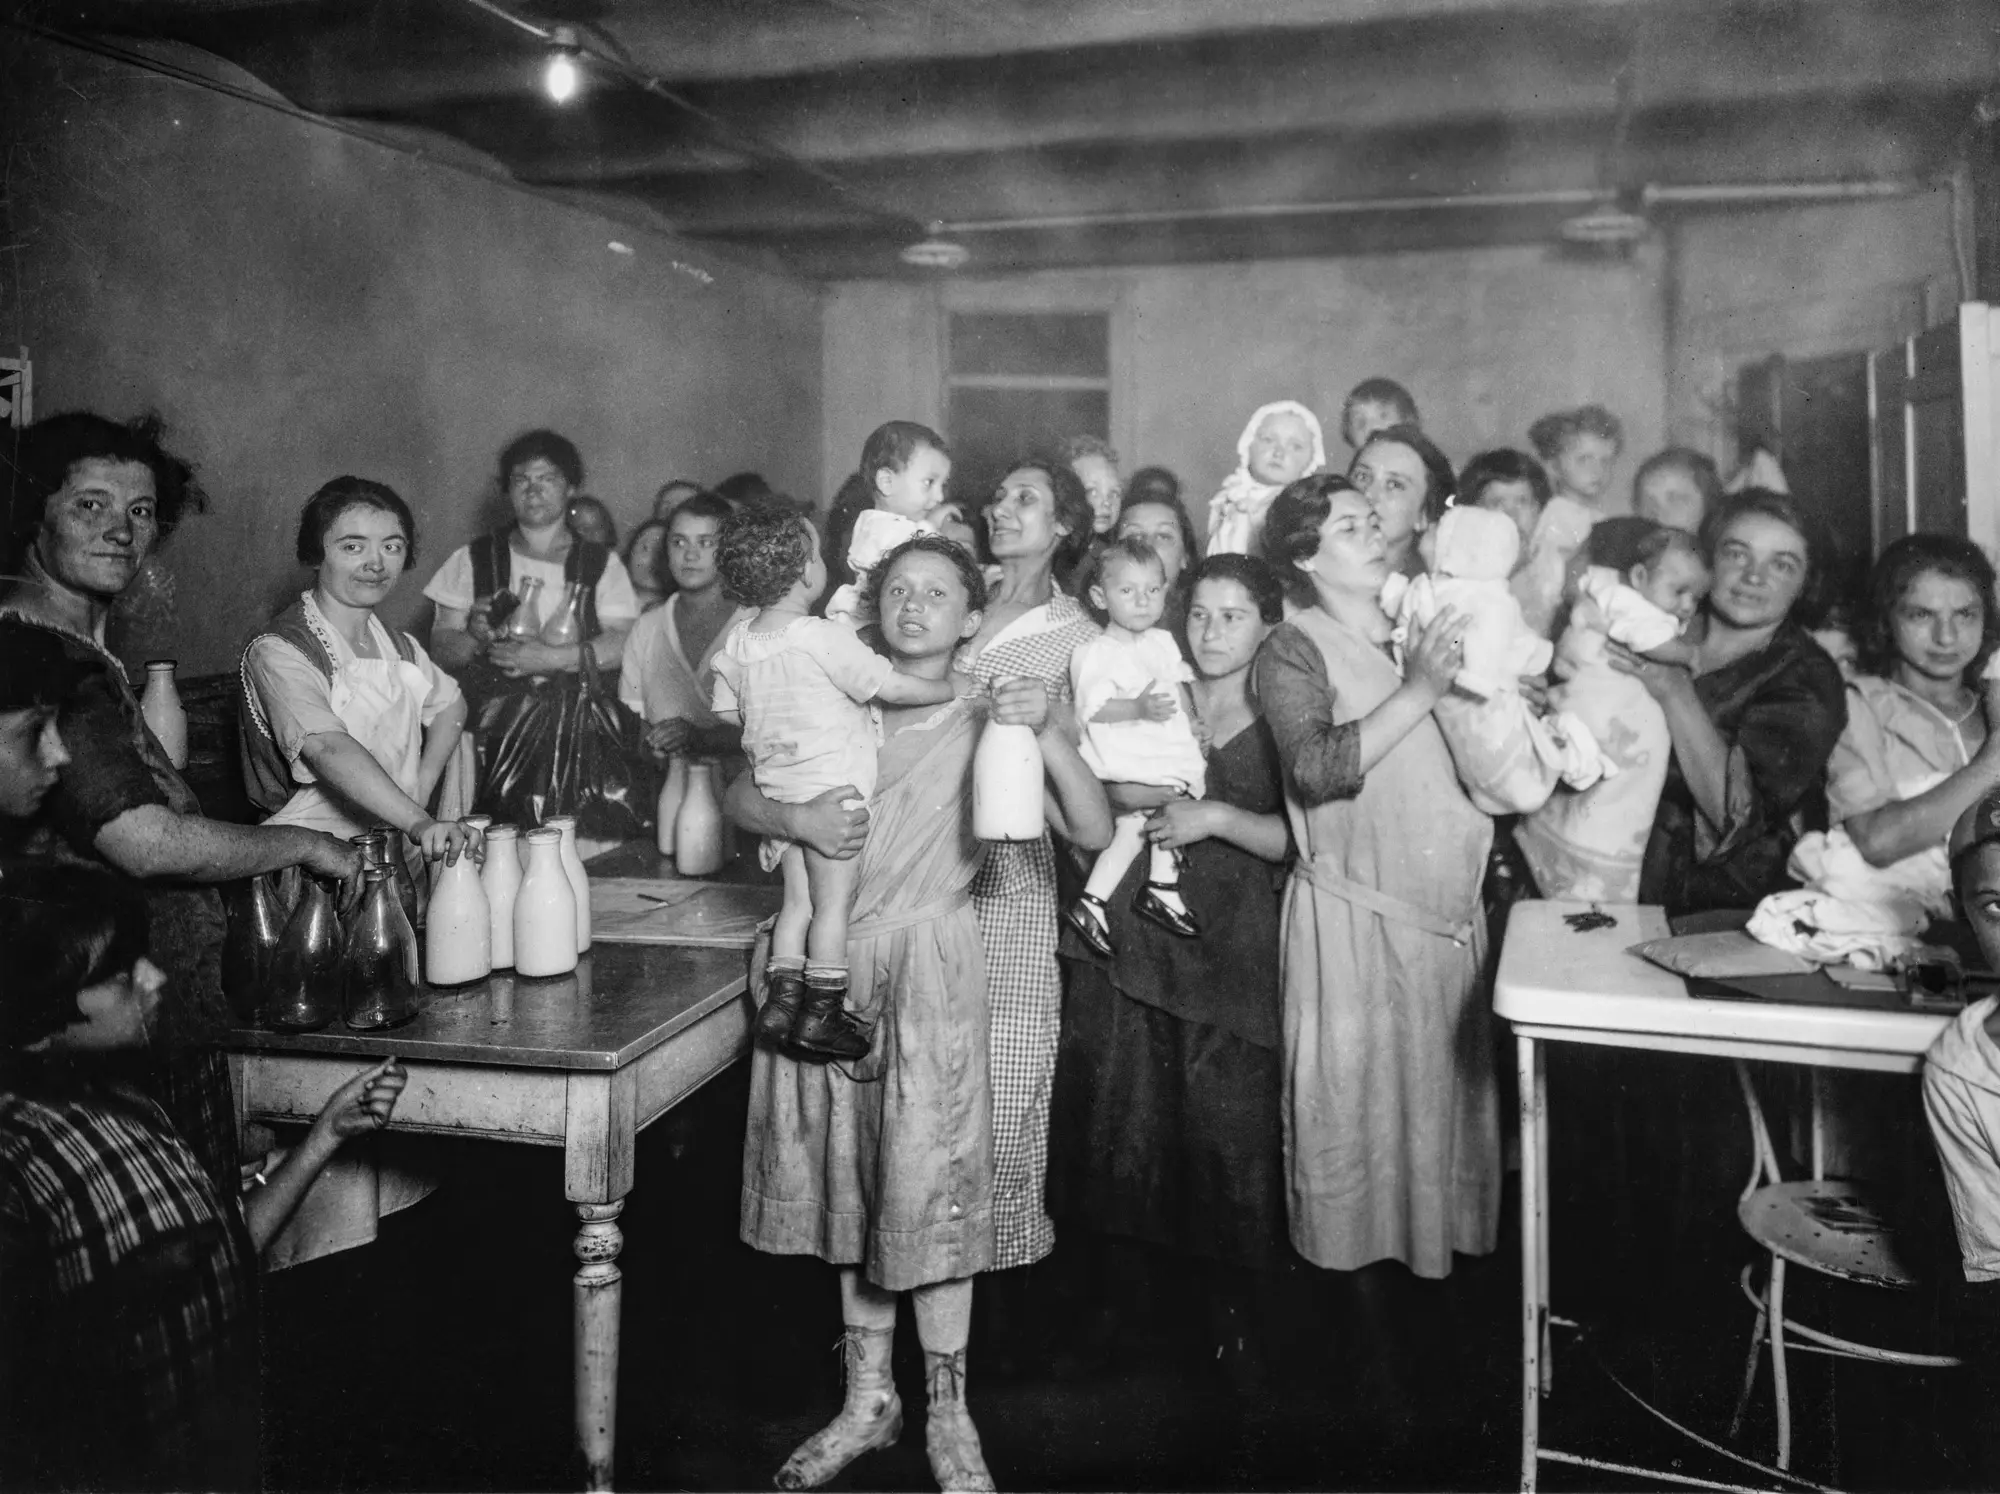
Average life expectancy in the 18th and 19th centuries was heavily influenced by high infant and childhood mortality rates. Infections such as dysentery, diphtheria, scarlet fever and pneumonia killed many babies and children.
Over the nation’s history, advances in technology, sanitation, food safety, and medicine, including the discovery of antibiotics in the 20th century, reduced infant mortality—the death of an infant before its first birthday—dramatically.
A lack of data on births and infant deaths in the 19th century United States makes it hard to gauge infant mortality, although by some historical estimates, up to 20 percent of infants died in the first year of life in the 19th century United States.
By 1915, when U.S. Census Bureau annual data on the subject was first available, the infant mortality rate in the United States was 100 per 1,000 live births.
In 2025, the infant mortality rate dropped to an all time low of 5.4 infant deaths per 1,000, according to the CDC.
Maternal mortality rates also plummeted. In 1900, the maternal mortality rate in the United States was about 850 women per 100,000 births, according to the American Journal of Obstetrics and Gynecology. In 2026, that number stands at just 17.9 deaths per 100,000 births, according to the CDC.