U.S. homeowners lost $1.3 trillion, or 7.6 percent, in home equity in the third quarter, the largest quarterly decline on record, according to the mortgage software and analytics company Black Knight.
Following the unprecedented real estate boom of the past two years, signs of a slowing housing market are beginning to emerge.
Homeowner equity contracted after peaking in the second quarter, Black Knight President Ben Graboske said.
“In the span of just three months, U.S. mortgage holders saw a total of $1.3 trillion in newly acquired equity evaporate,” he said in a statement.
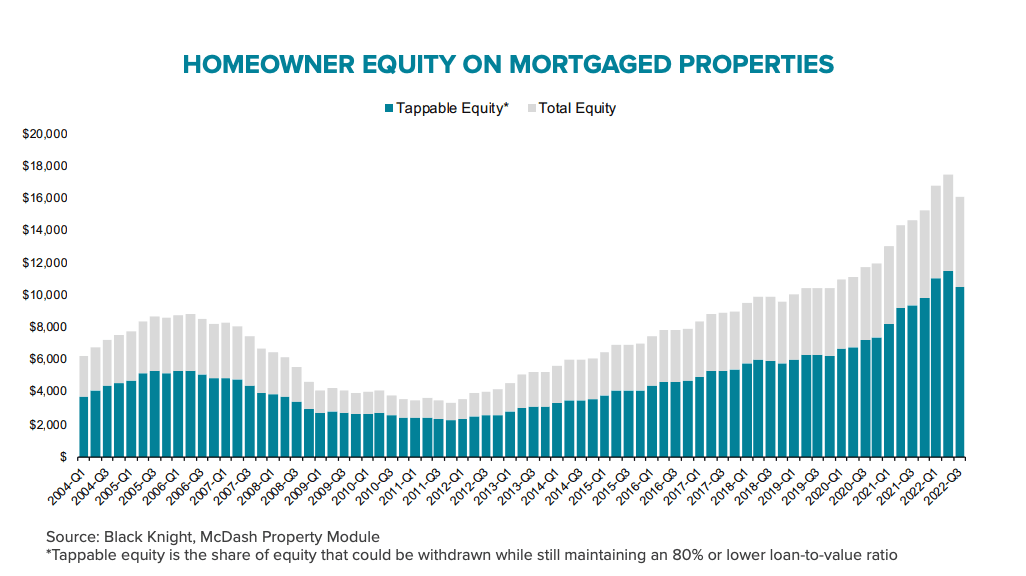
According to the report, equity among mortgaged homes is now about $1.5 trillion (minus 8.4 percent) lower than it was in May, with the average borrower’s equity having slumped by $30,000.
Despite this, “equity positions remain strong,” the report notes, citing that the average mortgage holder has $92,000 more in equity compared to before the pandemic.
However, the proportion of mortgage holders who are “underwater”—that is, owe more than the current value of their home—is increasing.
“From a risk perspective, we’ve already seen the number of underwater borrowers more than double alongside the equity pullback,” Graboske said while noting that the overall percentage of underwater owners remains historically low.
The vast majority of these underwater mortgage holders purchased their homes in 2022 or late 2021, which coincided with prices “at or near pandemic-era peak prices,” according to Graboske.
The report also found that “San Francisco became the first market to see prices fall year over year in September.” San Francisco’s annual growth rate came in at minus 1.3 percent, with the next lowest growth rate in San Jose, California, at 0.2 percent.
While Florida’s home price growth rates are steadily falling, the state continues to dominate the rankings, with four of its cities ranking in the top five in terms of yearly home price appreciation. Miami’s price appreciation was the highest in the country at 22.7 percent year-over-year.
Black Knight also tracked the impact of Hurricane Ian on the housing market. The report notes that 335,000 properties were in the direct path of the hurricane, suggesting that the owners “face a higher risk of property damage and mortgage delinquency.”
In aggregate, this grouping of mortgage holders accounts for an unpaid balance of roughly $71 billion.
By tracking mortgage payments through the first half of October, Black Knight discovered a slightly higher delinquency rate from property owners located in Ian’s path. The data firm estimates that 20,000 to 25,000 borrowers will be affected.
The report also states that real estate prices remain elevated compared to 2019 levels.
“Despite price corrections, home values in the nation’s 50 largest markets remain elevated by anywhere from 19 percent to 66 percent since the start of the pandemic,” it reads.
However, this isn’t likely to be the end of pain for homeowners, according to Graboske. As he sees it, continued tightening by the Federal Reserve “increases the potential for even further headwinds in equity lending, as well as heightened default risk.”