On Saturday, it was reported Apple hired former Tesla, Inc. autopilot software engineer, Christopher “CJ” Moore, to work on the tech giant’s self-driving electric vehicles expected to be released as soon as 2024. Moore will join a number of other ex-Tesla executives who have moved to Apple over the last while.
The Apple Chart
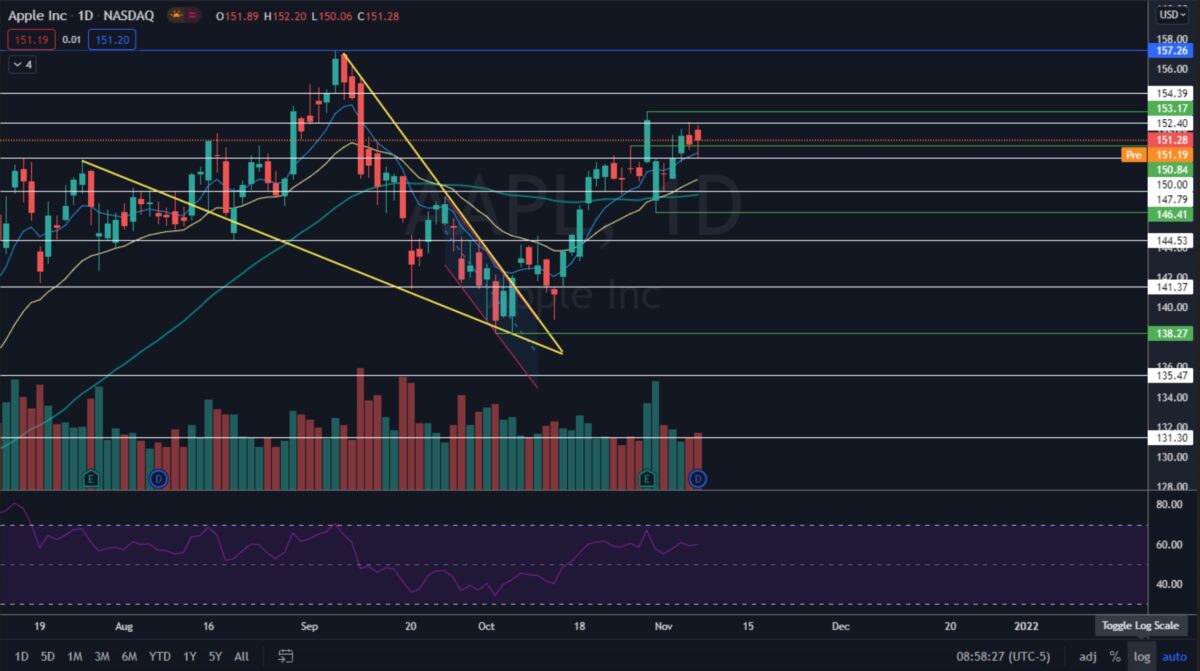
Apple broke up from a falling wedge on Oct. 6 and reversed into a fairly consistent uptrend, making a series of higher highs and higher lows until reaching an Oct. 28 high of $153.17. The stock then fell following its earnings print, made a lower low but recovered all of its losses before trading sideways for five days in consolidation.The five days of sideways consolidation set Apple into an inside bar on the weekly chart. The inside bar pattern is considered bullish because Apple was trading higher before falling into the pattern. Bullish traders can watch for a break of $153.17 for a possible run-up to the previous all-time high of $157.26 made on Sept. 7.
On the daily chart, Apple’s volume has been lower than average, which also indicates the recent price action is consolidation. The consolidation was needed because on Oct. 28 Apple’s relative strength index (RSI) reached about 70 percent and when a stock’s RSI reaches or exceeds the level it becomes overbought, which is can be a sell signal for technical traders.
Apple is trading above the eight-day and 21-day exponential moving averages (EMAs), with the eight-day EMA trending above the 21-day, both of which are bullish indicators. The stock is also trading above the 50-day simple moving average, which indicates longer-term sentiment is bullish.
Bulls want to see big bullish volume come in and drive Apple up over the Oct. 28 high-of-day, which will confirm the hammer candlestick printed on Friday was a bullish indicator. The stock has resistance above at $152.40 and $154.39 before reaching all-time highs.
Bears want to see big bearish volume come in and push Apple down a support level at $150, which would cause the stock to lose support of the eight-day EMA. Below the level, Apple has support at $147.79 and $144.53.