This copy is for your personal, non-commercial use only. Distribution and use of this material are governed by our Subscriber Agreement and by copyright law. For non-personal use or to order multiple copies, please contact The Epoch Times Reprints.
Canada’s top 20 percent of income earners pay more than half of all taxes collected, making them the only income group that pays a greater share of all Canadian taxes than their share of total income.
The top 20 percent of Canadian families ranked by income pay 56.9 percent of all taxes, while their share of total income is 47.8 percent, according to a Fraser Institute study released July 17. For all other income groups, the share of total income is higher than the share of taxes paid, with the bottom 20 percent earning two and a half times more than the portion of taxes they contribute.
“Despite the common misperception that top earners don’t pay their ‘fair share’ of taxes, the reality is these households pay a disproportionately large share of the total tax bill,” said Jake Fuss, director of fiscal studies at the Fraser Institute, who co-authored the study with senior economist Nathaniel Li.
“The assertion that the top 20 per cent of earners in Canada are not paying their fair share is simply not supported by the evidence.”
The federal government has previously said that by making the wealthiest Canadians pay their “fair share,” Canada’s tax system supports “fairness” for other generations.
“Canada’s tax system can be more fair. The wealthy are currently able to benefit from tax advantages that middle class Canadians and, especially, younger Canadians are rarely able to benefit from,” Ottawa said while proposing an increase in taxes on capital gains in its 2024 budget.
“We are asking the wealthiest Canadians to contribute a bit more, so that we can make investments to ensure a fair chance for every generation.”
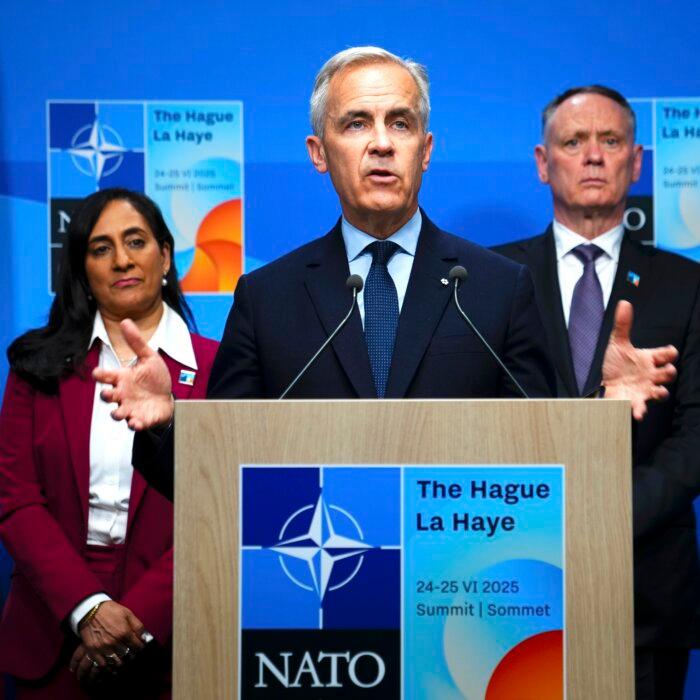
Meanwhile, Prime Minister Mark Carney earlier this year cancelled the proposed increase on the capital gains tax, saying his government is focused on “catalyzing investment, incentivizing builders for taking risks, and rewarding them when they succeed.”
The Fraser Institute study calculated the share of taxes paid by different income groups, organized in quintiles, using a tax simulator that incorporates data from Statistics Canada’s social policy simulation database and model, which analyzes financial interactions between governments and Canadians.
The authors used family income rather than individual income, saying this better reflects a person’s economic situation. For example, someone with no personal income may still be in a top-earning household if their spouse is among the top 20 percent of earners.
The analysis found that for the three middle income groups, their share of total income is also greater than their share of taxes paid, although the difference narrows as income levels increase.
Families in the second income group from bottom to top, who earn between $65,089 and $112,125, receive 9.9 percent of total income and pay 6.9 percent of total taxes, according to the study.
Those in the third group, with incomes from $112,126 to $169,492, receive 15 percent of income and pay 13.1 percent of taxes. Meanwhile, families in the fourth group, earning between $169,493 and $261,609, receive 22.5 percent of income and contribute 21.2 percent of taxes.
For the top 20 income-earning families, whose income sits above $261,609, tax contributions exceed their share of income by 9.1 percentage points.
The authors say the “disproportionate” contribution is due, in part, to the progressivity of Canada’s tax system, where the share of taxes paid typically increases as income grows.
They argue that the tax framework fails to account for behavioral responses from taxpayers, such as tax planning or avoidance, when faced with higher taxes, and that it reduces Canada’s competitiveness.
“Increasing taxes on top income earners makes Canada a less attractive place to live and to work for highly skilled people such as doctors, scientists, managers, and software engineers,” reads the report.