Commentary
Japan has become a new case study for both academics and the markets. After decades of spiraling deflation, researchers are now examining a new era. Although potential structural change has been reflected in stock and housing prices, the weak Yen may have substantially contributed to the recent investor interest. As Japan resists global tightening, a widening interest rate or yield gap would naturally depreciate the currency and attract cross asset classes carry trade, that is, short currency and long risk-on assets. Thus, a good market performance might not be showing the true picture.
To see what this new era is revealing, one should go back to basics and examine the economic, rather than financial variables. Paying particular attention to inflation, the Bank of Japan (BoJ) correctly states that inflation’s lagged nature is a good indicator for confirming trends. That is, as the lagged variable improves, the boom should be confirmed. Yet in an aggregate supply-demand (AS-AD) schedule, a rise in inflation could be due to either supply or demand, or both supply and demand, which is most likely. But supply-side-driven inflation is never a desirable indicator.
Using market clearing as the only assumption, the basic supply and demand principles can be used to chart the AS-AD locus and tell us what type of shock to expect over a certain period. That is, supply always equals demand, without any disequilibrium. Both price and quantity variables do have trend and cycle components, but the analytical context is only concerned with the latter. Therefore, the trend component must first be removed, either by using standard academic procedures or by change of form.
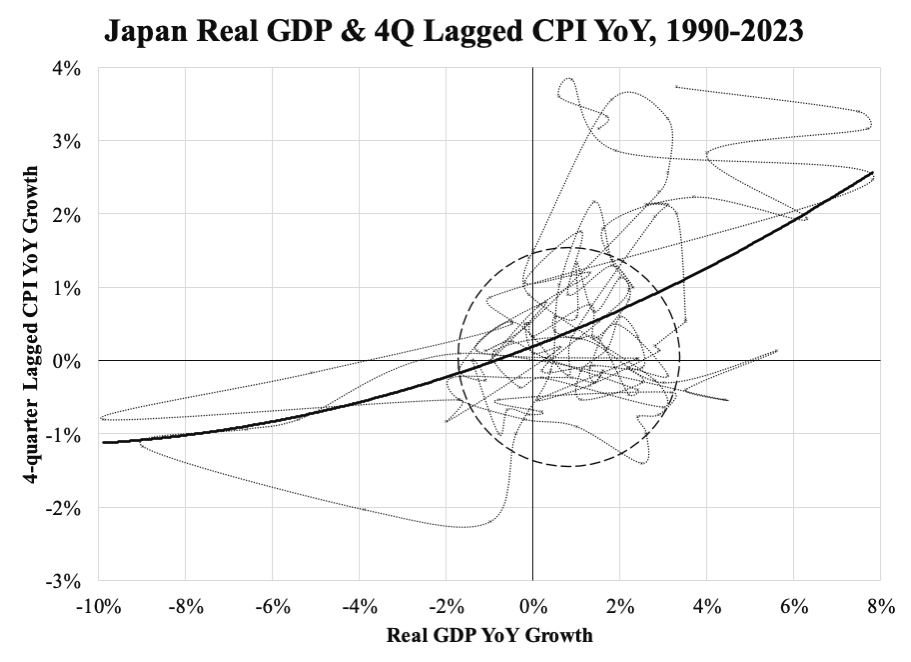
The accompanying chart shows the change form of both price and quantity variables, which are typically measured by CPI and GDP respectively, with both in year-over-year (YoY) growth rate. CPI takes the overall one to match that of GDP, in which food and energy are not excluded. In principle, the GDP deflator is conceptually a better companion to GDP than CPI, but the latter is better known to the public and is the policy target. Using post-1990 quarterly data, correlation calculations show that CPI YoY lagged GDP YoY by four quarters.


The locus is nonlinear, suggesting price and quantity are asymmetrically related about point zero. Deflation, in fact does more harm, as 1 percent deflation is associated with over 7 percent of GDP shrinkage. However, inflation reacts strongly to GDP growth in the positive quadrant whenever both price and quantity growth deviate significantly from their trend levels (the dashed circle with origin: GDP YoY at about 1 percent, CPI YoY at about zero percent). A glimpse immediately tells us that GDP YoY and CPI YoY are increasing at one-to-one mode (note, the grid lines are doubly spaced for GDP).
Data over the past two years clearly shows that GDP trend growth has increased to 1.25 percent. The one-to-one mode implies the same for CPI, suggesting a normal policy rate should be near 2 percent, and even higher for long-tenor yield.
KC Law, Ka Chung