Tesla Inc. was trading slightly higher in the premarket on Tuesday after a three-day reversal to the upside saw the electric vehicle giant soar by 21 percent.
The company’s Shanghai production facility is currently rolling about 2,000 new vehicles off its assembly lines, which is about 70 percent of its pre-lockdown output capacity, after re-adding a second shift last week. Surging COVID-19 cases in Shanghai led to lockdown the city earlier this year and Tesla has been grappling with worker shortages and supply chain issues as it continues to ramp up production.
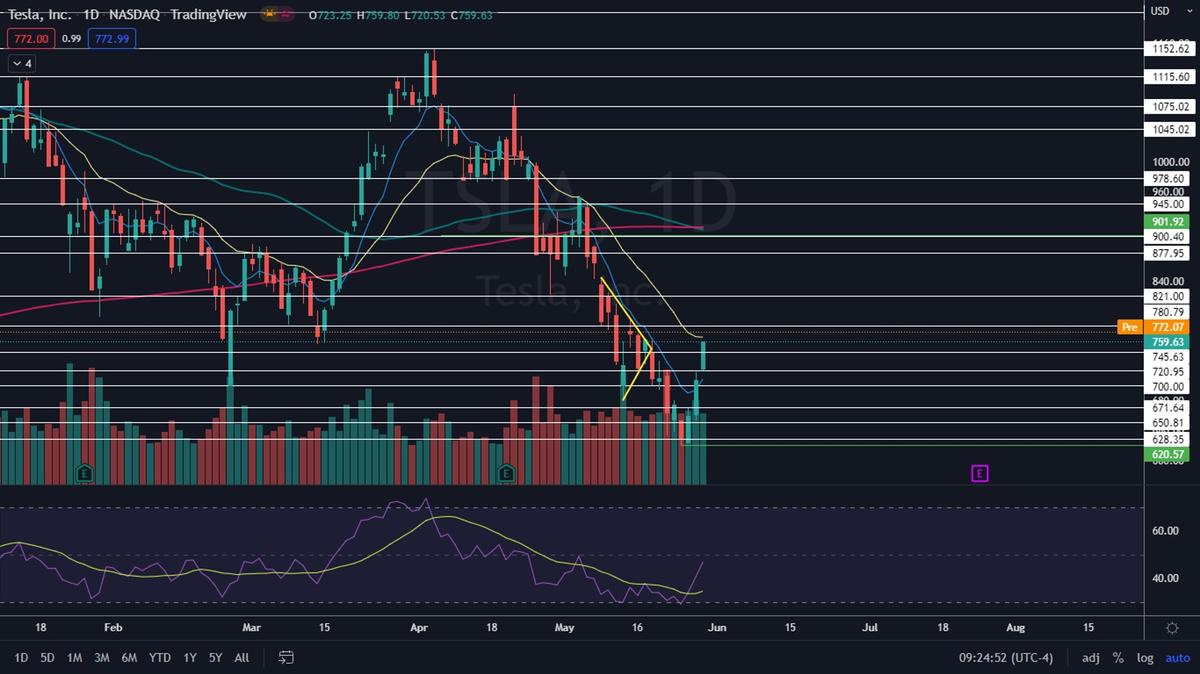
Tesla Chart
On Friday, Tesla printed a bullish kicker candlestick but closed the trading session just short of regaining the 21-day exponential moving average (EMA) as support. If the stock is able to pop up above the area and remain trading above it for a period of time, the eight-day EMA will eventually cross back above the 21-day, which would give bullish traders more confidence going forward.Although Tesla negated its downtrend by rising up above the most recent lower high, which was printed on May 23 at $679.96, the stock hasn’t yet confirmed an uptrend due to lack of a higher low on the daily chart. Bulls will want to see Tesla eventually retrace lower to print a higher low, which may also provide a solid entry point for traders who’ve missed the run higher.
Bearish traders will be hoping the recent price action is merely a relief rally and for a bull trap to occur. Despite the rise higher, the 50-day simple moving average (SMA) has begun to cross below the 200-day SMA, which is likely to cause a death cross to form over the coming days.
Tesla has resistance above at $780.79 and $821 and support below at $745.63 and $720.95.