Inflation and Recession Are Becoming Entrenched

Inflation and Recession Are Becoming Entrenched
(Uros Stepisnik/Shutterstock)
David Stockman
10/14/2022
Updated:
12/21/2023
0:00
News Analysis
What do you expect? According to Joseph Biden, as conveyed through the teleprompter, we are already in the clear:

“‘No,’ Biden said when asked by CNN’s Jake Tapper if Americans should prepare for a recession.

“‘It hadn’t happened yet,’ the president added later. ‘I don’t think there will be a recession. If it is, it’ll be a very slight recession. That is, we’ll move down slightly.’”

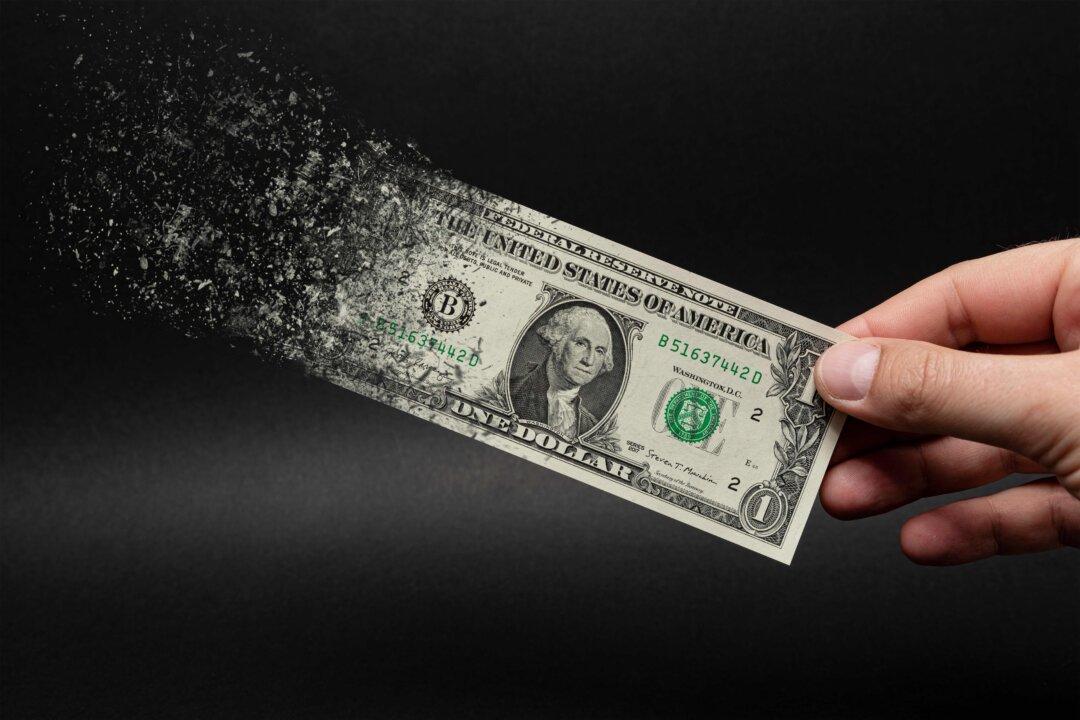
No, not even close. The virulent inflation that has been unleashed on the world by the central banks and the Washington war machine is now so deeply embedded that it will require what President Eisenhower’s Treasury Secretary back in the day called “a hair-curling recession” to bring it to heel.
Oct. 12 PPI report for September should remove any cause for doubt. That is to say, the Fed has raised interest rate by 300 basis points in the last six months, yet the upstream inflationary pressures embodied in the producer price index have not even budged.
In fact, so-called “core inflation” for finished goods less food and energy came in at 8.4 percent Y/Y. That’s the highest level since July 1981.
Yes, monetary policy is held to work with a lag. But there is still no way to read the chart below and conclude that the Fed is even close to being done in its anti-inflation campaign. In fact, from the bottom (January 1976) to the top (April 1980) of the 1970s inflation cycle, the rise in the core PPI amounted to 600 basis points (@5.0 percent to @11.0 percent).
By contrast, from the low in February 2020 to September 2022, the core PPI has risen by 740 basis points (from 1.0 percent to 8.4 percent) on a Y/Y basis. Moreover, it only took 31 months to happen compared to 51 months during the 1976–1980 cycle.

So what we have is the very opposite of Powell’s hideous “transitory” inflation. We are talking about the so-called core index here, thereby excluding the even more vicious up-cycle in food and energy.

At bottom, therefore, this inflation is virulent, embedded, and not going to be easily eliminated, even by a miraculous collapse of gasoline or grocery store prices.

Core Producer Price Index for Finished Goods Less Food And Energy, 1976–2022. (Data: Federal Reserve Economic Data [FRED], St. Louis Fed)
In that context, it needs be recalled what happened the last time the Fed was confronted with a 600+ basis point increase in the core PPI inflation: Namely, Volcker raised the Federal funds rate by 1400 basis points, not a mere 300; and it took all of six years to finally bring inflation back to earth.

To be sure, we have no idea as to how high and how long the Fed will require to bring inflation under control during this cycle. But it will surely be far, far in excess of 300 basis points and the pain will be spread over years, not months, as has been the case to date.

Fed Funds Rate, January 1976 to August 1981. (Data: Federal Reserve Economic Data [FRED], St. Louis Fed)

On reason inflation proved to be so intractable during the Volcker era is that stagflation got deeply embedded in the economy, meaning that the kind of “itty bitty” recession that Joe Biden was gumming about on Oct. 11 was not nearly up to the task.

The fact is, we have a live fire historical demonstration about why the “soft landing” hopes of the Fed, the permabulls and the Biden crowd is sheer fantasy. We are referring to the fact that Volcker did engineer a mini-recession in the spring of 1980, but it didn’t put a dent in the inflation momentum.

As shown below by the purple line, real GDP peaked in Q1 1980 and then declined thru Q3 1980 during Volcker’s mini-recession. During that two-quarter interval of “shallow and short,” real GDP contracted by just 2.2 percent. But the inflation rate (brown line) just kept on climbing, rising at an annualized rate of 9.5 percent during the period.

That is to say, the mule needed a stronger 2X4 betwixt the eyes, a therapy that Volcker soon realized was unavoidable.

Real GDP Versus Core PPI, Q4-1979–Q4 1980. (Data: Federal Reserve Economic Data [FRED], St. Louis Fed)
The second round of the Volcker anti-inflation medicine took another chunk out of real output—this time 2.6 percent from the Q3 1981 peak to the Q4 1982 bottom. Still, inflation stubbornly resisted the recessionary medicine, rising at a 5.3 percent annual rate during the five-quarter downturn.
Real GDP Versus Core PPI, Q3 1981 to Q4 1982. (Data: Federal Reserve Economic Data [FRED], St. Louis Fed)

Moreover, the impact on the labor market was severe. Over the course of the double-dip recession, the U-3 unemployment rate rose from 6.0 percent in August 1979, when Volcker took the helm in the Eccles Building, to 10.8 percent at the December 1982 bottom.

Likewise, the number of unemployed nearly doubled during this period, rising from 6.3 million to 12.1 million. Accordingly, purging the virulent inflation that became embedded in the wage-price-cost nexus looked nothing like Joe Biden’s itty bitty recession, nor the “soft landing” that Wall Street bulls never stop peddling.

Unemployment Rate And Unemployment Level, August 1979 to January 1983. (Data: Federal Reserve Economic Data [FRED], St. Louis Fed)

As it happened, core PPI inflation did not return to the 2.00 percent zone until Q4 1983. That is, it took Volcker two recessions and four years to wrestle the core PPI rate back to the Fed’s current purported inflation target. By any definition of the term, that’s not “short and shallow.”

Y/Y Change in Core PPI, 1976 to 1983. (Data: Federal Reserve Economic Data [FRED], St. Louis Fed)

When all is said and done, Volcker’s conquest of the 1970’s inflation came at a steep price to the macro-economy because there was no alternative once the inflationary spiral became embedded.

In fact, the chart below makes the cost of the double-dip recession plain as day: To wit, real GDP of $6.82 trillion in Q4 1979, when Volcker threw on the monetary brakes, was still at $6.81 trillion by Q4 1982, when the economy finally hit bottom. That is to say, three years of zero net growth in real output.

But even then, the core PPI—which runs lower than the CPI—was still at 4.7 percent in Q4 1982. Consequently, Volcker did not get the Fed funds rate under 6.0 percent until October 1986.

Y/Y Change In Core PPI Versus Real GDP Level, Q4 1979 to Q4 1982. (Data: Federal Reserve Economic Data [FRED], St. Louis Fed)

Needless to say, the Volcker era proved that “stagflation” is a stubborn beast once it worms its way into the price structure of the economy. That’s why the Oct. 12 announcement from Pepsi should get the last word.

The soft drink and snack giant said its expected 2022 revenue growth of 12 percent on the back of a 17 percent increase in average price across its entire product portfolio!

The math obviously speaks for itself, even though Pepsi understandably sought to spin the implied 5 percent shrinkage in volume as a “slight decline” in overall sales volume.

In short, a bad stagflation is here. Since the Fed will be locked in a battle to tame the price side of the equation even as real output falters for months and years to come, we seriously doubt that the economic contraction to be recorded on Joe Biden’s watch will be described in the history books as a “very slight recession.”
Originally published on StockmansContraCorner, reposted from the Brownstone Institute
Views expressed in this article are opinions of the author and do not necessarily reflect the views of The Epoch Times.
David Stockman is senior fellow of Brownstone Institute. His career in Washington began in 1970, when he served as a special assistant to U.S. Representative, John Anderson of Illinois. From 1972 to 1975, he was executive director of the U.S. House of Representatives Republican Conference. Stockman was elected as a Michigan Congressman in 1976 and held the position until his resignation in January 1981. He then became Director of the Office of Management and Budget under President Ronald Reagan, serving from 1981 until August 1985. After leaving government, Stockman joined Wall Street investment bank Salomon Bros. He later became one of the original partners at New York-based private equity firm, The Blackstone Group. Stockman left Blackstone in 1999 to start his own private equity fund based in Greenwich, Connecticut. He is the author of many books on politics, finance, and economics. He runs the subscription-based analytics site ContraCorner.
Related Topics