Ethereum was trading almost 2 percent higher at one point on Tuesday, which caused the cryptocurrency to rise up above the April 16 high of $3,086.83, negating a downtrend pattern Ethereum had been trading in since April 3.
Although Ethereum will need to print a higher low above Monday’s low of $2,880, the crypto has made the first indication it may begin trading in an uptrend.
An uptrend occurs when a stock consistently makes a series of higher highs and higher lows on the chart.
The higher highs indicate the bulls are in control while the intermittent higher lows indicate consolidation periods. Traders can use moving averages to help identify an uptrend with rising lower timeframe moving averages (such as the eight-day or 21-day exponential moving averages) indicating the stock is in a steep shorter-term uptrend and rising longer-term moving averages (such as the 200-day simple moving average) indicating a long-term uptrend.
A stock often signals when the higher high is in by printing a reversal candlestick such as a doji, bearish engulfing or hanging man candlestick. Likewise, the higher low could be signaled when a doji, morning star or hammer candlestick is printed. Moreover, the higher highs and higher lows often take place at resistance and support levels.
In an uptrend, the “trend is your friend” until it’s not and there are ways for both bullish and bearish traders to participate in the stock:
Bullish traders who are already holding a position can feel confident the uptrend will continue unless the stock makes a lower low. Traders looking to take a position in a stock, trading in an uptrend can usually find the safest entry on the higher low.
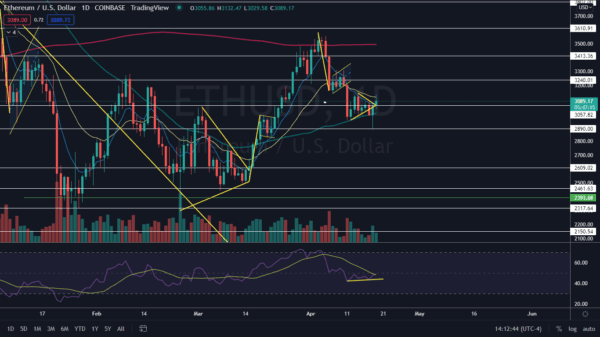
The Ethereum Chart
Ethereum created a bear trap on Sunday when it broke down from a triangle formation the crypto had developed on the daily chart. Ethereum then fell further on Monday but bulls came in and bought the dip, which caused the crypto to close the 24-hour trading session back up at the apex of the pattern.On Tuesday, Ethereum reversed course and broke up bullishly from the triangle but a lack of volume was causing the crypto to struggle to regain the 21-day exponential moving average (EMA). Ethereum may need to consolidate sideways on smaller timeframes in order to gain the power needed to regain the level as support.
Ethereum has developed bullish divergence on the daily chart, where the relative strength index has made a series of higher lows while the crypto’s price made a series of lower lows. In order for the divergence to correct, Ethereum will need to trade up higher over the coming days.
For bullish traders who are not already in a position, a solid entry could be made if Ethereum forms a reversal candle, such as a doji or hammer candlestick, above Monday’s low-of-day. Bearish traders may choose to go short for a scalp when Ethereum prints a bearish reversal candlestick such as a shooting star candle or a doji.
Ethereum has resistance above at $3,240.01 and $3,413.36 and support below at $3,057.82 and $2,890.