Here’s Why Carnival Corporation Stock May Change Course

Here’s Why Carnival Corporation Stock May Change Course
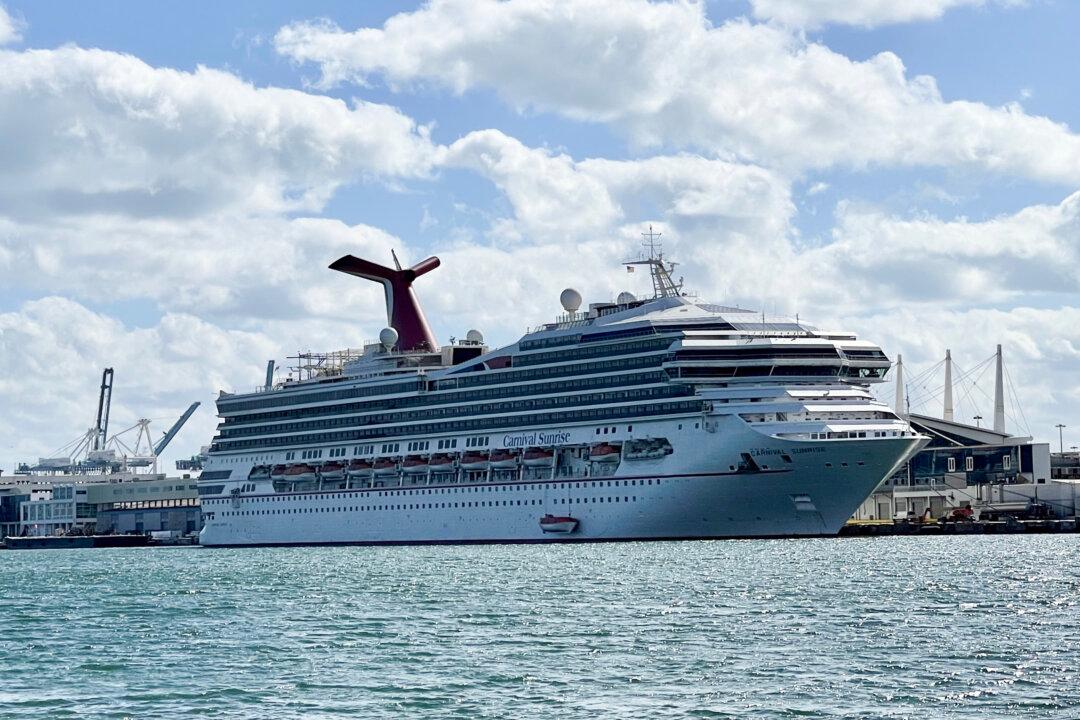
The cruise ship "Carnival Sunrise," part of the Carnival Cruise Line, moored at a quay in the port of Miami on Dec. 23, 2020. (Daniel Slim/AFP via Getty Images)
Benzinga
5/27/2022
Updated:
5/30/2022

Carnival Corporation was surging over 9 percent on Thursday in tandem with the general markets, which saw the S&P 500 rising about 1.5 percent.

Despite the economy slowly reopening over the past year, stocks in the travel sector have largely failed to reap gains, and Carnival has plunged about 60% since June 8, 2021, when the stock hit a 52-week high of $31.52.
Since April 21, Carnival has been trading in a steep and consistent downtrend, plummeting about 43 percent to reach a 52-week low of $11.56 on Tuesday. The stock tested the area as support again on Wednesday, which formed a double bottom pattern on the daily chart, and on Thursday, Carnival was reacting to that formation.

A double bottom pattern is a reversal indicator that shows a stock has dropped to a key support level, rebounded, back-tested the level as support, and is likely to rebound again. It is possible the stock may retest the level as support again creating a triple bottom or even quadruple bottom pattern.

The formation is always identified after a security has dropped in price and is at the bottom of a downtrend whereas a bearish double top pattern is always found in an uptrend. A spike in volume confirms the double bottom pattern was recognized and subsequent increasing volume may indicate the stock will reverse into an uptrend.
  • Aggressive bullish traders may choose to take a position when the stock’s volume spikes after the second retest of the support level. Conservative bullish traders may wait to take a position when the stock’s share price has surpassed the level of the initial rebound (the high before the second bounce from the support level).
  • Bearish traders may choose to open a short position if the stock rejects at the level of the first rebound or if the stock falls beneath the key support level it created the double bottom pattern at.
The Carnival Chart: For technical traders, the double bottom pattern indicated Carnival was likely to trade up higher on Thursday, paired with Carnival closing the trading day near its high-of-day on Wednesday. Carnival’s relative strength index (RSI) had already fallen into oversold territory, which also signaled that the stock was likely to reverse course to the upside.
  • Despite the surge higher, Carnival is trading in a downtrend, with the most recent lower high printed at $14.96 on May 17 and the most recent lower low formed at the low-of-day on Tuesday. In order for Carnival to reverse course into an uptrend, the stock will need to either soar up above the $15 level or consolidate lower to print a higher low.
  • Carnival is likely to trader up higher in the near-term because there is bullish divergence on the daily chart, which will eventually need to correct. Bullish divergence occurs when a stock makes a series of lower lows while the RSI makes a series of higher lows.
  • If Carnival closes the trading day near its high-of-day price, the stock will print a bullish kicked candlestick, which could indicate higher prices will come on Friday. Ideally, bullish traders would like to see Carnival close the trading session above the eight-day exponential moving average.
  • Bearish traders will want to watch for Carnival to eventually print a reversal candlestick, such as a doji or hanging man candlestick, to indicate that at least the temporary top is in and the stock will retrace lower.
  • Carnival has resistance above at $14.23 and $16.38 and support below at $12.11 and the 52-week low.
(Benzinga)
(Benzinga)
By Melanie Schaffer
© 2022 The Epoch Times. The Epoch Times does not provide investment advice. All rights reserved.