Twitter, Inc. was spiking up over 3 percent on Tuesday after falling almost 28 percent beginning on May 5 to reach a $36.85 low, putting Tesla, Inc. CEO Elon Musk in the red on the 9.2 percent stake he took in the social media app on March 14.
The majority of the recent decline was caused by the implication that Musk’s deal to buy Twitter for $54.20 per share (announced on April 25) is on the brink. Musk has recently demanded proof from Twitter’s CEO Parag Agrawal, to show that the proportion of bots on the microblogging app are less than 5 percent, which Musk claims Agrawal has refused to do.
“This deal cannot move forward until he does,” said Musk in a reply to @Teslerati early on Tuesday morning.
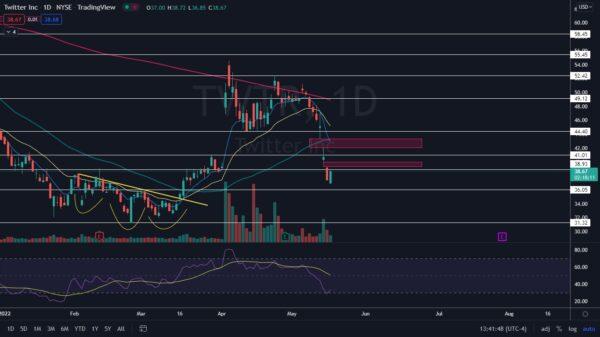
The Twitter Chart
Despite falling off a cliff on May 5, Twitter hasn’t confirmed it’s trading in a downtrend because the stock has yet to print a lower high. When Twitter completes its bounce to the upside, bearish traders and investors can watch for a reversal candlestick such as a shooting star or doji candlestick as a signal a retracement to the downside is likely to come.Bullish traders can watch for a reversal candlestick, such as a doji or hammer candlestick, to develop when Twitter makes its next low and if the low is above Tuesday’s low-of-day, the stock may reverse into an uptrend.
The bounce on Tuesday, which could carry on into Wednesday, was likely to come because Twitter’s relative strength index (RSI) reached 28 percent on Monday. When a stock’s RSI reaches or falls below the 30 percent level, it becomes oversold, which can be a buy signal for technical traders.
Twitter has resistance above at $38.93 and $41.01 and support below at $36.05 and $31.32.