Apple Inc. was trading slightly higher in the premarket on Friday in tandem with the S&P 500 E mini-futures, which were rising up over 1 percent.
The tech giant has been trading in a heavy and consistent downtrend since March 30, plunging about 23 percent to reach a low of $136.60 on Thursday.
A downtrend occurs when a stock consistently makes a series of lower lows and lower highs on the chart.
The lower lows indicate the bears are in control while the intermittent lower highs indicate consolidation periods.
Traders can use moving averages to help identify a downtrend, with descending lower time frame moving averages (such as the eight-day or 21-day exponential moving averages) indicating the stock is in a steep shorter-term downtrend.
Descending longer-term moving averages (such as the 200-day simple moving average) indicate a long-term downtrend.
A stock often signals when the lower low is in by printing a reversal candlestick such as a doji, bullish engulfing or hammer candlestick. Likewise, the lower high could be signaled when a doji, gravestone or dragonfly candlestick is printed. Moreover, the lower lows and lower highs often take place at resistance and support levels.
In a downtrend, the “trend is your friend” until it’s not, and in a downtrend, there are ways for both bullish and bearish traders to participate in the stock:
Bearish traders who are already holding a position in a stock can feel confident the downtrend will continue unless the stock makes a higher high. Traders looking to take a position in a stock trading in a downtrend can usually find the safest entry on the lower high.
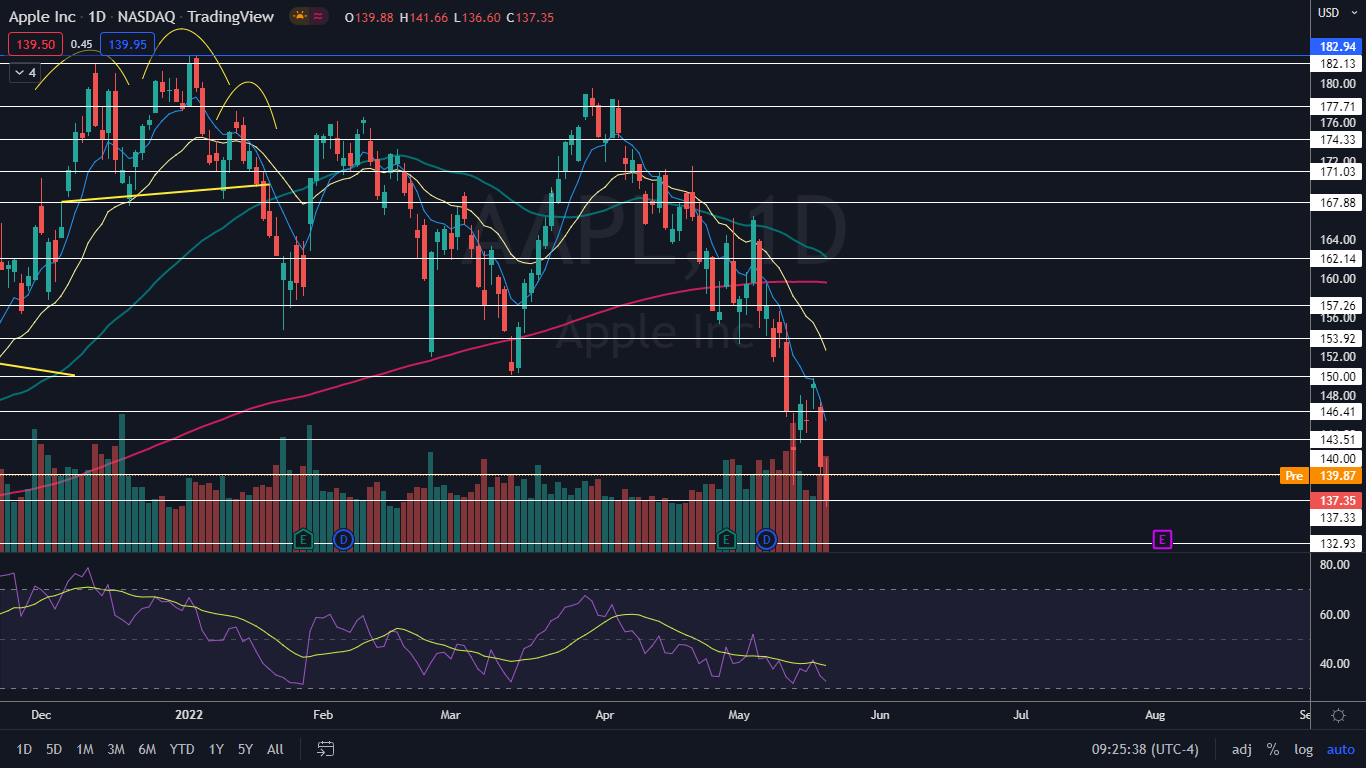
The Apple Chart
The most recent lower high in Apple’s downtrend was printed on May 17 at $149.77 and the most recent confirmed lower low was printed at the $138.80 mark on May 12. If Apple trades higher on Friday, Thursday’s low-of-day may serve as the next lower low within the pattern.A bounce to the upside is likely to come on Friday because Apple’s relative strength index (RSI) reached about 32 percent on Thursday, putting the stock near oversold territory. When Apple reached the same level on May 12, the stock shot up almost 8 percent over that day and the three trading days that followed to print its next consecutive higher low.
In order for Apple to buck its downtrend, the stock will either need to shoot up above the most recent lower high or form a higher low above Thursday’s low-of-day, which is what bullish traders who want to take a long position will want to see. Short-term bullish traders may choose to play Apple counter-trend to catch the next lower high.
Bearish traders wishing to enter a short position can watch for Apple to form a bearish reversal candlestick, such as a doji or shooting start candlestick, under the most recent lower high, with the anticipation the stock will continue in its downtrend.
Apple has resistance above at $140 and $143.51 and support below at $137.33 and $132.93.