Global Climate Agencies Publish Dubious Emissions Calculations, Tighten the Noose Around Energy

Global Climate Agencies Publish Dubious Emissions Calculations, Tighten the Noose Around Energy
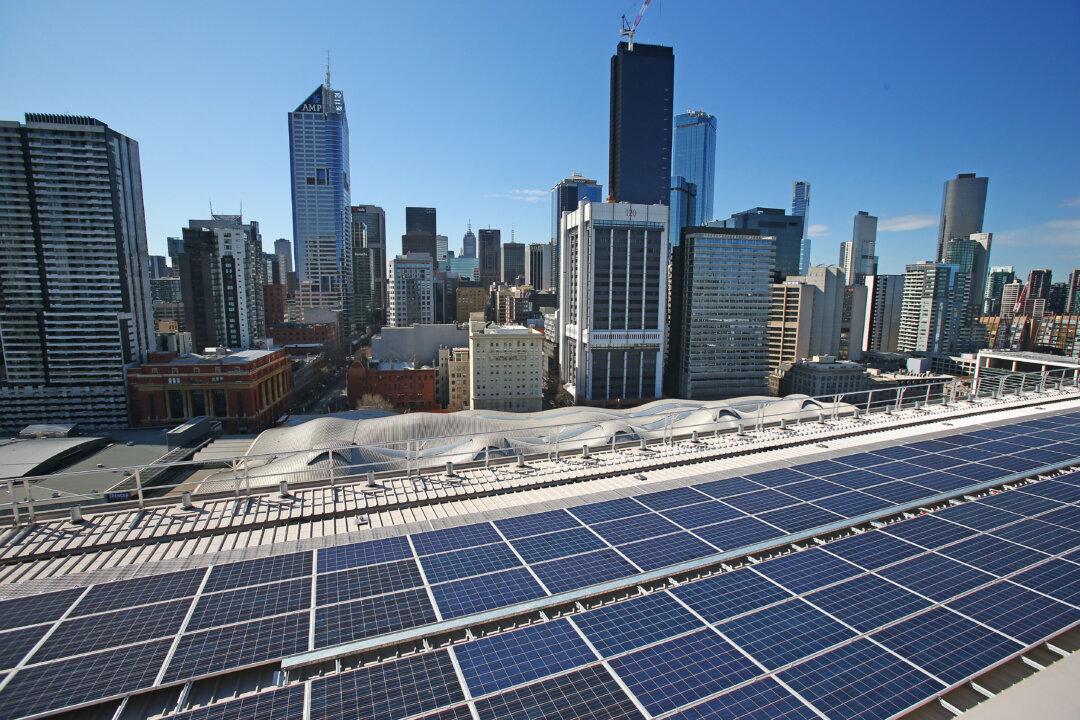
Solar panels are seen on the rooftop at AGL's new Docklands office in Melbourne, Australia, on Aug. 20, 2015. (Scott Barbour/Getty Images)
Peter Castle
7/17/2023
Updated:
7/23/2023
0:00
Commentary

The International Energy Agency (IEA) is again demonstrating its usefulness in creating whips for Western governments to flagellate themselves with.
Last time, it was their Net-Zero report, which recommended building no new fossil-fuel-fired power stations. Ever. It was released the day before Australia approved a new gas-fired power station.

This time, it is the IEA’s “global methane tracker,” which has come up with an emission estimate higher than any of the other existing estimates.

Their estimate was recently “analysed” by the Institute for Energy Economics and Financial Analysis (IEEFA), which despite its name, is merely a U.S.-based non-profit climate activist organisation.

They concluded that Australia’s official estimate should be 81 percent higher for the coal industry and that the “oil and gas” methane emission estimate should be 92 percent higher!
<span lang="EN-US" xml:lang="EN-US">Comparison of Fugitive Methane Emissions Estimates by IEA (2022) with National Inventory Emissions Data (2020–21). (IEEFA)</span>
Comparison of Fugitive Methane Emissions Estimates by IEA (2022) with National Inventory Emissions Data (2020–21). (IEEFA)

Their conclusion from this was that the Australian government’s “safeguard mechanism” is insufficiently aggressive and that we will need to nearly double the rate that we are proposing to reduce methane emissions in order to achieve the same end goal.

The IEEFA’s report presenting this analysis comes to six pages—longer than the press release but far from transparent—and has generated a round of headlines.

Yet actually, The Guardian reported on this in February, shortly after the IEA report was published. And in fact, if the IEEFA had done less “analysis” and more reading, they would have noticed the IEA report already made the comparison for them and got slightly different numbers.
Australia methane emissions from all sources, comparison with UNFCCC and other estimates. (<a href="https://www.iea.org/data-and-statistics/data-tools/methane-tracker">IEA</a>/<a href="https://creativecommons.org/licenses/by/4.0/deed.en"><span class="cc-license-identifier">CC BY 4.0</span></a>)
Australia methane emissions from all sources, comparison with UNFCCC and other estimates. (IEA/CC BY 4.0)

Analysis Is Problematic on Multiple Levels

The largest problem with the IEEFA’s report, however, is not the unknown mathematical error but rather their conclusion for the safeguard mechanism.

The safeguard mechanism, for those who are not familiar, is a government-mandated program for reducing Australia’s greenhouse gas emissions.

Under the program, the 215 largest Australian emitters (those that directly emit more than 100,000 tonnes of carbon dioxide equivalent each year) are required to reduce their emissions at a rate of 4.9 percent per year over the next seven years.

Importantly, the “safeguard mechanism” is not designed to achieve a specific level of emissions but rather to establish a downward trend. It uses Australia’s official emissions figures, estimated and reported via the Clean Energy Regulator according to a process set under Australia’s “National Greenhouse and Energy Reporting Scheme” (NGER).

Suppose an industry promises to reduce its emissions, and then rather than actually reducing them, it only changed the way those emissions were measured. That would create outrage, and rightly so.

Yet that is what the IEEFA are proposing for Australia’s safeguard mechanism. The baseline emissions targets were set based on NGER reporting, but they are proposing to change the IEA measurements while still targeting the same final levels.

Actually, even under the NGER, the calculation method has frequently been changed, causing artificial drift in the reported emissions year-on-year. Yet adopting the IEA estimate instead would very suddenly add a large burden to the major emitters.

The Karratha Gas Plant in Australia is seen in this undated handout photo. (Woodside/Handout via Reuters)

But the IEEFA analysis is even more nonsensical for two other reasons.

Firstly, the safeguard mechanism applies to total emissions, not just methane emissions. Even if the methane counting has this error, the CO2 emissions have to be added on before the impact of the error can be properly estimated.

Secondly, the IEA estimate does not report the emissions from individual companies but for the entire industry sector. It cannot really be used to track performance against the safeguard mechanism, which makes it a poor basis for setting targets for the mechanism.

Though it has made headlines, it is also not obvious that the IEA estimate is a better estimate than the others available.

The IEA assigned methane emissions to different industry sectors by scaling them from reported U.S. data, which assumes that the performance of U.S. businesses is representative of the rest of the world. They then scaled the estimates using satellite measurements, where such data was obtained.

Yet it has long been observed that top-down estimates of methane emissions vary significantly from bottom-up estimates, and that estimation is difficult. Methane is emitted from a large range of different sources. No method of assigning the release to a specific source is foolproof.

Why Villainize Methane to Begin With?

Before we hyperventilate over the apparent underestimating of our energy sector’s methane emissions, it is worth being aware of the “big picture” of methane.

The majority of methane emissions are from natural sources—specifically, tropical wetlands—then agriculture and landfill and the energy industry. The energy sector is not the main emission source.

In all of these sectors, Australia is also a very small emitter compared to other countries. This has been especially notable recently, when sudden, large methane emissions have been traceable to specific large-scale leak events, such as the Nordstream Pipeline ruptures.

Global sources of methane. (The Global Carbon Atlus)

While methane is continually emitted into the atmosphere, it is also continually removed from the atmosphere by natural processes so that the amount that is actually accumulating is a small fraction of what is entering.

Methane levels have been increasing recently at an increasing rate. Yet these recent changes have been attributed to an increase in natural wetland emissions and, ironically, a decrease in NOx pollution (nitrogen oxides). The process that breaks down NOx pollution from the air also removes methane.

Energy is a fundamental cost encapsulated in all modern productivity. The safeguard mechanism, even with its current targets, is already an impost on the sector that is likely to drive costs upwards across all industries.

Unlike CO2, methane is at least a useful commodity; capturing methane and using it (or selling it) for energy is worthwhile. The industry does not lightly throw methane away.

Decreasing emissions will be difficult in places where the industry is already efficient. The emitters will have to purchase emission offsets.

They don’t mind this, they will simply pass costs onward, which will drive up fuel prices at a time when fuel is scarce, and prices are already high.

The IEEFA analysis and conclusions are taking another opportunity to seek to punish Australia’s energy sector. They ought to realise that the more we hit our energy sector, the more we hit ourselves.

Views expressed in this article are opinions of the author and do not necessarily reflect the views of The Epoch Times.
Peter Castle is an Australian mechanical engineer with broad experience in the oil and gas, energy, and other process industries.
Related Topics