A number lower than that means the economic growth was declining regardless of a much higher number in Q2 than in Q1. Another way is to read the quarter-over-quarter figure. However, there could still be a “seasonal effect” that a statistical filter cannot completely remove. Such impact would be unavoidably obvious when huge items like bank loans or policy boosts are prone to happen in some specific periods of a year. A common seasonal filter cannot smooth out such large swings in typical communist nations.
Discussing data of a dictatorship nation in a Western way might not be meaningful at all. Data are highly likely fake, especially when the government has a strong desire for window dressing to attract foreign capital, which is precisely what China has been doing lately. The reason behind this must be that the situation is bad enough that they have no other way out but to seek help from the rest of the world. Fake data in emerging countries are not uncommon. To date, quite a portion of the official data from even the BRICS countries is fake to a large extent.
Chinese data in the past were fake in a more obvious way. Before 2020, China’s real GDP growth was so “linear” that it could almost be comparable to a ruler-drawn straight line. Look at all other countries. Common sense tells us that no GDP series looks like that unless it is fake. Figures in recent years look more “natural” thanks to big data tools available for manipulation. As discussed above, the incentive to fake is still high, given the strong desire for foreign capital. Finding direct evidence to “prove” the fake is difficult, but indirect evidence is abundant.
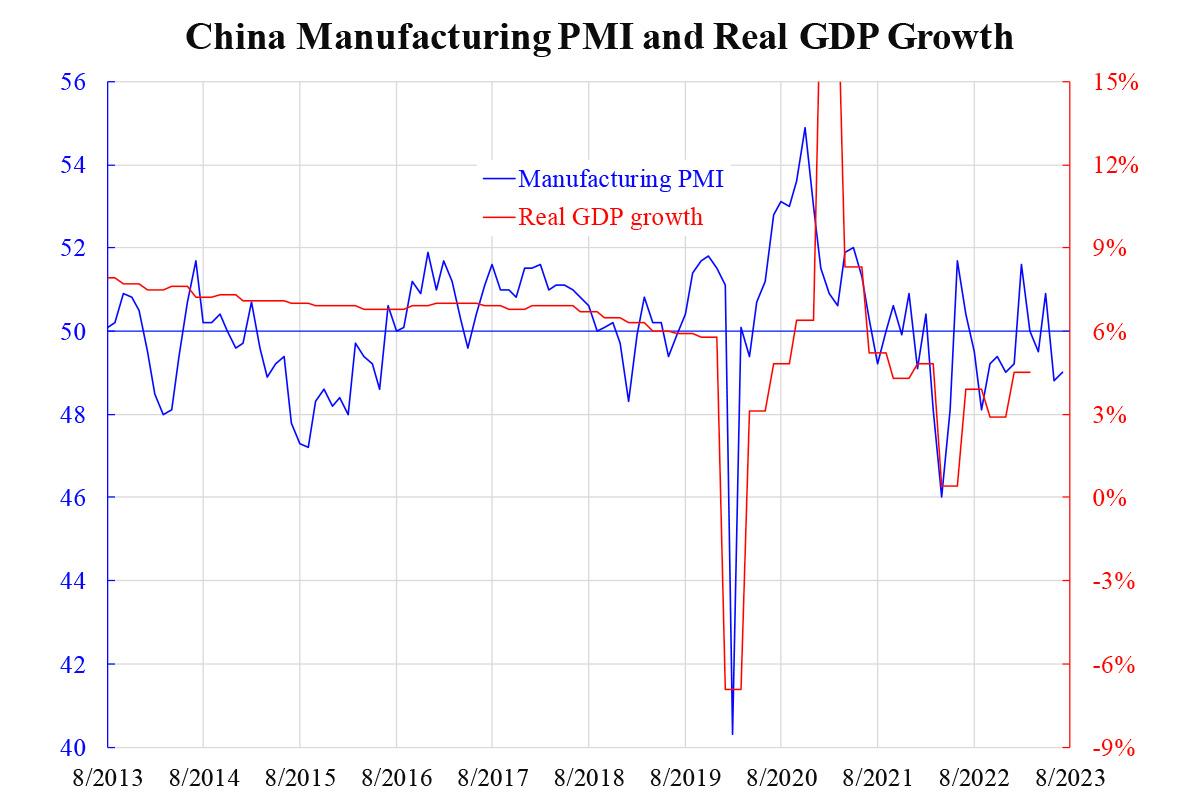
One obvious point is when the growth rate is too high to be true—elevated to the extent that almost no one in the country agrees, that does not match casual observation or even other official data. Look at the official manufacturing PMI in the attached chart, which the government released; 50 is the divide between expansion and contraction. Compared to real GDP growth, a PMI of 50 corresponds not to zero GDP growth but to 6 percent. The government never explains that anomaly that no one dares to question.
Maybe this is the so-called Chinese-style data. Indeed, this can only happen over long years under a dictatorship.
China’s Percentage GDP YoY Growth:
2022: Q1 4.8, Q2 -0.4, Q3 3.9, Q4 2.9.
2023: Q1 4.5, Q2 6.3.