

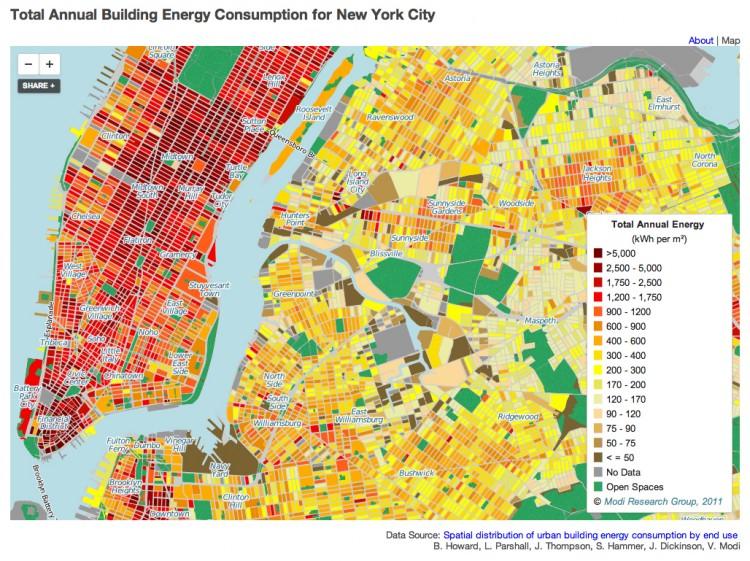

NEW YORK—The Fu Foundation School of Engineering and Applied Sciences at Columbia University released a map last week showing New York City’s energy consumption lot by lot.
“If you’ve got some building owners next to each other they can compare and see if they can share resources,” explained Holly Evarts, spokesperson for Columbia’s engineering school. Professor Vijay Modi lead a team in developing the map to help policy makers and city planners work toward greater energy efficiency.
A burgundy cluster in Midtown shows the highest concentration of energy consumption in the city. The Financial District is a similar hue.
The map shows consumption by lot, however, not by area, so it makes sense that Midtown high-rises would use more energy than family residential buildings in Brooklyn.
A separate graph (http://modi.mech.columbia.edu/nycenergy/about.html) shows annual energy use divided by the total building floor area. Hospitals and health facilities have the highest energy usage intensity (EUI), followed by stores, schools, and Manhattan office spaces. Residential family buildings have the lowest EUI.
The map shows the proportion of energy used for space heating and cooling, electricity, and water heating when the cursor is placed over a lot.
“Interesting,” writes one commentator on the online map. “I looked at the house where I grew up, and the identical house around the corner where my grandparents used to live. I know that while our houses were identical, my grandparent’s house’s basement was outfitted as a rental apartment, and ours wasn’t. This was reflected in energy usage, with our old place consuming roughly a third less energy.”
The map makers want the map to spark such dialogue, but they warn, “We encourage users to compare their buildings, but keep in mind that many factors affect a building’s energy usage.”
“You know the thing that fascinates me,” writes another commentator, “is the total population of the earth (a tad over 8 billion) all wanting energy like those in America and a few other countries, and just how impossible that is.”


