Advanced Micro Devices, Inc. and Nvidia Corporation have both formed long-term bullish chart patterns that could provide massive upside for the long-minded trader and investor.
Both stocks have formed a bull flag pattern on the weekly chart, with AMD and Nvidia looking close to completing their patterns. When a bull flag pattern is formed on a small time frame such as an hourly chart, the breakout, if the pattern is recognized, can last hours.
When it is formed on a larger time frame, such as a weekly chart, the breakout can last weeks. This makes bull flags on larger time frames especially powerful.
It should be noted, however, that events such as the general markets turning bearish, negative reactions to earnings prints, and negative news headlines about a stock can quickly invalidate bullish patterns and breakouts.
In the News
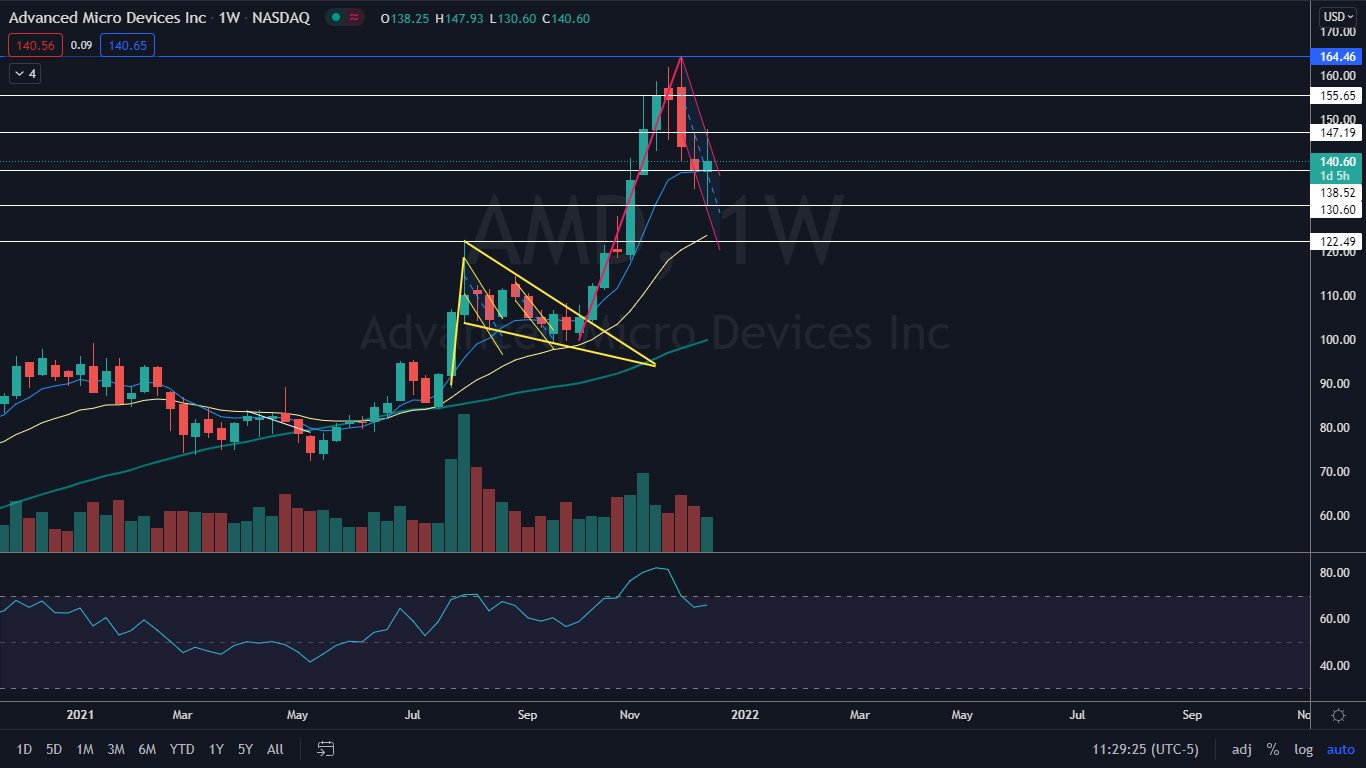
At 10 a.m. on Jan. 4 EST, AMD President and CEO Lisa Su will host AMD’s Product Premiere. The virtual even will highlight the AMD Ryzen processors and AMD Radeon graphics.The AMD Chart
AMD reached a Nov. 22 all-time high of $164.46 and has since settled into a weeks-long period of consolidation.- The rise to a new all-time high paired with the consolidation has settled the stock into a bull flag pattern, with the pole created during the weeks of Oct. 4 through to Nov. 29 and the flag formed over the following three weeks.
- For the flag to remain valid, AMD will need to close the week above the eight-day exponential moving average (EMA) on the weekly chart.
- Traders who are not already in a position may choose to enter if AMD breaks up from the flag on high volume, which could indicate the bull flag has been recognized.
- AMD has resistance above at $147.19 and $155.65 and support below at $138.52 and $130.60.
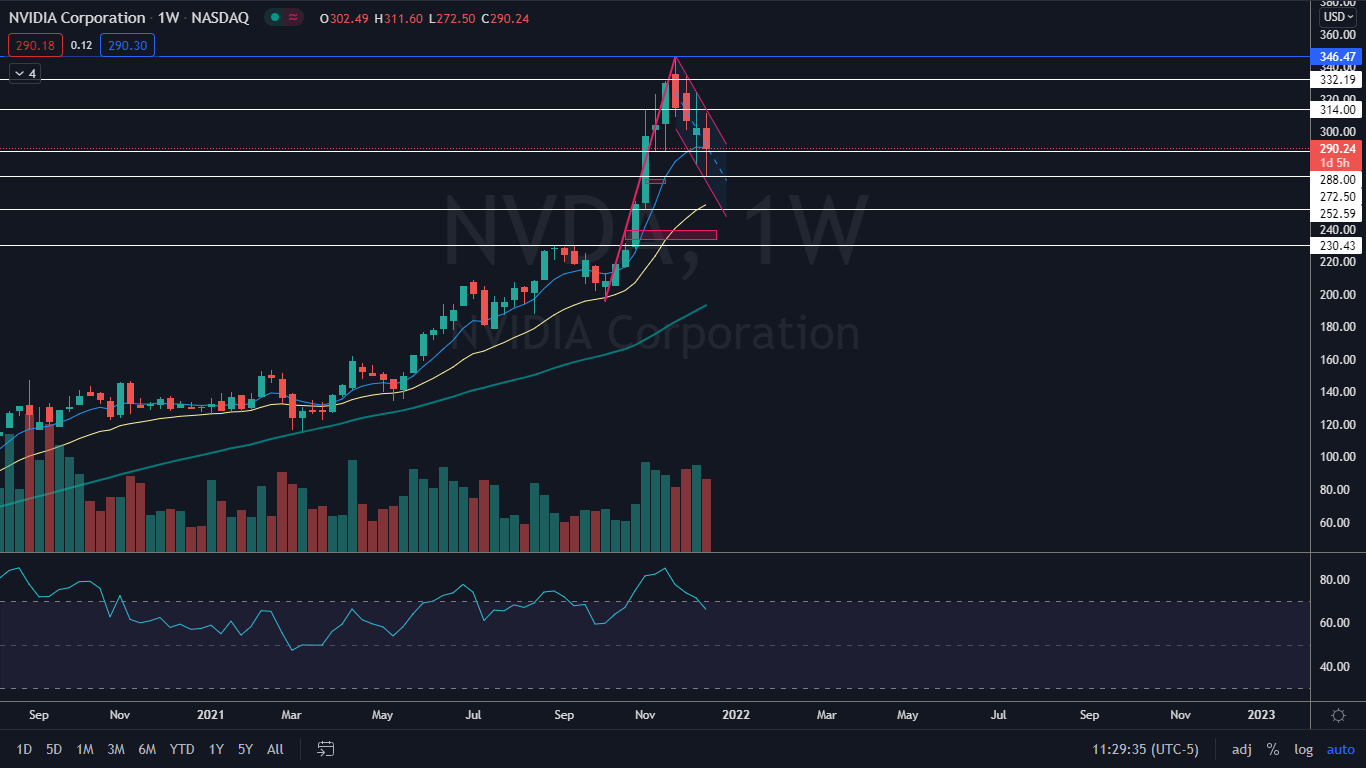
The Nvidia Chart
Nividia’s bull flag has a pole that was created between the weeks of Oct. 4 and Nov. 22 and a flag that formed between during the weeks that followed.- There are two gaps below on Nvidia’s chart that may make bullish traders wary, because gaps on charts fill about 90 percent of the time. It should be noted, however, that it could be a significant amount of time before that happens.
- As with AMD’s bull flag, Nvidia will need to close the week above the eight-day EMA for the flag to remain intact.
- Nvidia has resistance above at $314 and $332.19 and support below at $288 and $272.50.