Tesla Inc. was plummeting 10 percent on Tuesday, sliding through both the 50-day and 200-day simple moving averages (SMAs), which plunged the stock into bearish territory.
The move came on higher-than-average volume, which indicates there’s fear around Tesla’s stock. This was likely accelerated by news CEO Elon Musk was successful in his bid to acquire Twitter Inc. The general markets have also been under pressure recently with geopolitical events worrying investors and impending rate hikes causing traders to weigh the likelihood of an impending recession, which Tesla is not immune to.
From a technical standpoint, Tesla’s stock was set to trade lower regardless of any news events because the stock had settled into a bear flag pattern on the daily chart, which Benzinga called out on April 20.
The bear flag pattern is created with a steep drop lower forming the pole, which is then followed by a consolidation pattern that brings the stock higher between a channel with parallel lines or into a tightening triangle pattern.
For bullish traders, the “trend is your friend” (until it’s not) and the stock may continue to rise upwards within the following channel for a short period of time. Aggressive traders may decide to purchase the stock at the lower trendline and exit the trade at the higher trendline.
Bearish traders will want to watch for a break down from the lower descending trendline of the flag formation, on high volume, for an entry. When a stock breaks down from a bear flag pattern, the measured move lower is equal to the length of the pole and should be added to the highest price within the flag.
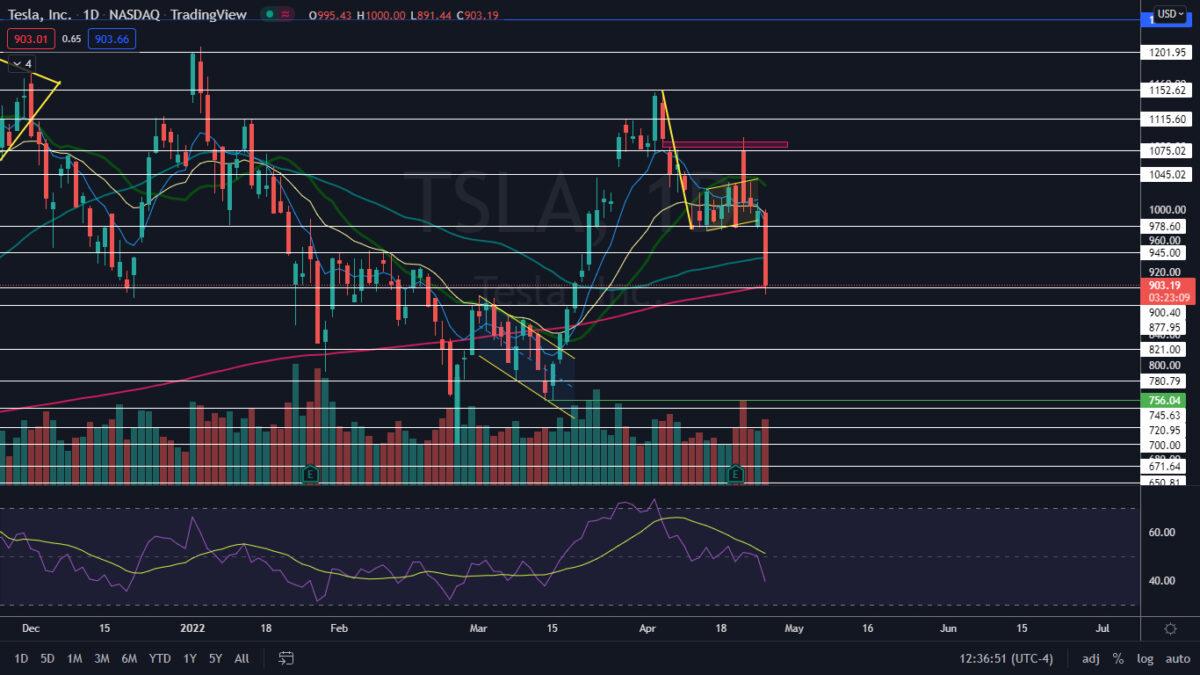
Tesla Chart
Tesla’s bear flag was created between April 5 and Monday, with the downward sloping pole formed over the first five trading days of that period and the flag formed between April 12 and Monday. After Tesla printed its first-quarter earnings on April 20, the stock soared up out of the flag but on the day following dropped back into the pattern, which created a bull trap.The measured move of the break from the flag is about 15 percent, which indicates Tesla could fall toward the $875 mark. If the stock closes the trading day near its low-of-day price, Tesla is likely to fall further on Wednesday and possibly complete the move.
The higher-than-average volume indicates not only fear selling but that there’s a high interest in short positions and puts. At press time, over 27 million shares of Tesla had exchanged hands compared to the 10-day average of 21.81 million.
Bullish traders will want to see Tesla close the trading session above the 200-day SMA because if the stock doesn’t, the level will become heavy resistance and may eventually cause the 50-day SMA to cross below the 200-day, which would cause a death cross to occur on Tesla’s chart.
Tesla has resistance above at $945 and $978.60 and support below at $900 and $877.75.