

Palantir Technologies Inc. shares are trading lower Monday as the market continues to dip. The market as a whole has been dropping the past couple of weeks as technology stocks see a bear market.
Palantir was down 11.35 percent at $12 at publication Monday.
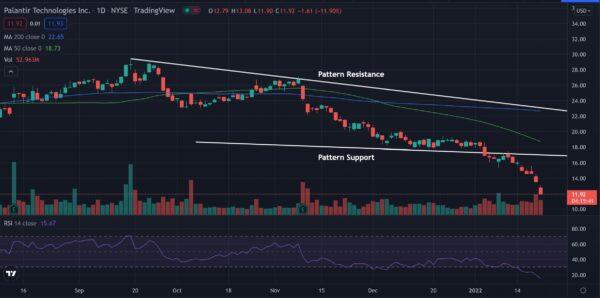
Palantir Daily Chart Analysis
The stock was trading in what technical traders call a falling wedge pattern and fell below the support level showing the stock is not yet ready for a reversal. The stock looked as though it was going to bounce off support, but the market crash made it drop lower.The stock trades below both the 50-day moving average (green) and the 200-day moving average (blue). This indicates bearish sentiment and each of these moving averages may hold as an area of resistance in the future.
The Relative Strength Index (RSI) continues to crash lower and now sits at 16. This shows the RSI is heavily into the oversold region and shows the stock is seeing much more selling pressure than it is buying pressure. If the RSI continues to stay below 30, the price will likely continue falling.
Benzinga
What’s Next for Palantir?
Palantir falling below support in the pattern shows that the stock is in control of the bears. The drop below the support level shows a strong selling presence. Bears are looking to see the stock continue to do what it’s doing. Bears want the price to stay below the pattern support and hold below the moving averages and keep falling. Bulls are looking to see the stock start to bounce back in time and form higher lows up toward the pattern once again. Bulls are also looking to see the price climb back above the moving averages for a possible change in sentiment.By Tyler Bundy
© 2021 The Epoch Times. The Epoch Times does not provide investment advice. All rights reserved.


