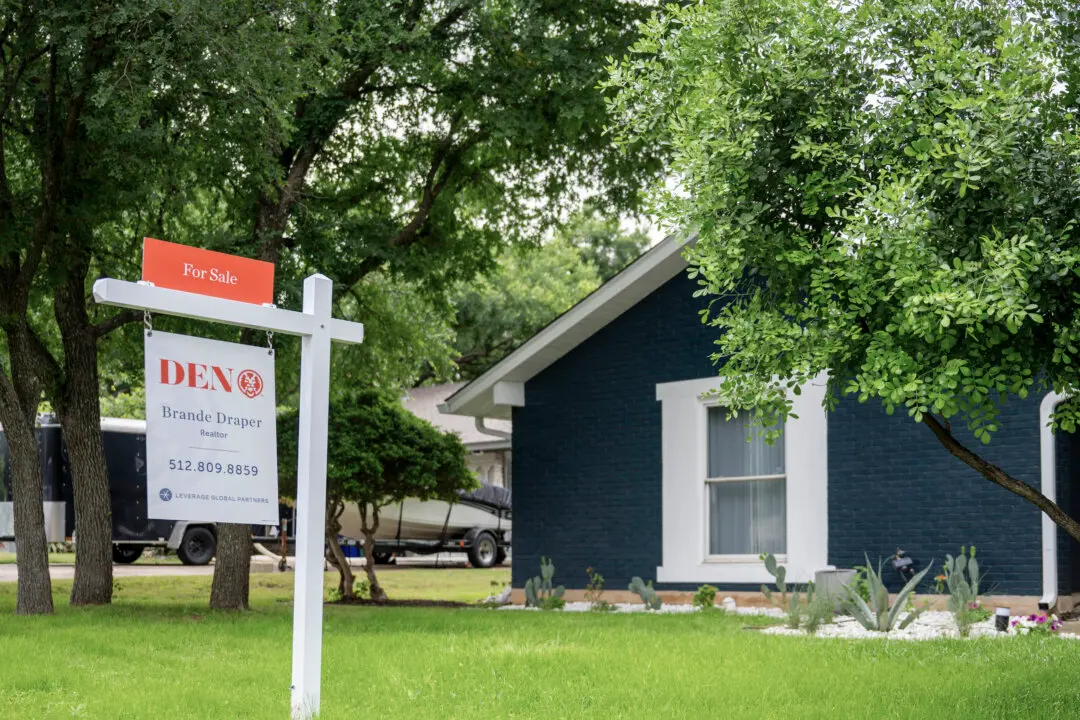
Potential homebuyers on the sidelines may get a break this summer as list prices decreased by 2.5 percent year over year in June, the biggest decline since 2017, according to a July 1 report by Realtor.com.
Another sign that the market could be rebalancing is that, for the first time in 26 months, homes were on the market for no longer than a year earlier, and pending sales climbed by 3.7 percent year over year—increasing for the seventh month in a row—the housing listings and data platform indicated.
“Eight straight months of falling prices and seven straight months of rising pending sales are not a contradiction,” Realtor.com chief economist Danielle Hale said in the report. “Sellers are reading market conditions and are pricing accordingly from the start rather than listing high and cutting later, and buyers are taking note and making bids.”
According to the report, June’s national median sales price was $430,000—basically unchanged from May, but 2.5 percent lower than at the same time in 2025. The price per square foot experienced a 2.1 percent year-over-year decrease.
The national home search database also found that the share of listings offering price reductions was at 18.8 percent in June, representing a 1.9 percent decline from a year ago.
After reaching a $449,000 peak in June 2022, the national median list price has slipped by 4.2 percent. The West saw the sharpest decline of 7.3 percent, followed by the South at 3.5 percent.
However, the Northeast and Midwest seemed to defy the trend with median price growth of 12.6 percent and 10 percent, respectively.
“The two Americas story in housing is now four years in the making,” Realtor.com senior economist Jake Krimmel added in the report. “In the West and South, prices gave ground back as affordability limits were tested. In the Midwest and Northeast, supply stayed tight enough and demand strong enough that prices kept climbing even through a historic rate shock.”
An analysis of year-over-year price activity shows declines of 4.0 percent in the West, 2.5 percent in the South, and 1.0 percent in the Northeast. Home prices in the Midwest region remained flat.
Last month, Realtor.com tracked 1.103 million active listings nationwide, up by 4.1 percent from May, and 1.9 percent from June 2025. New listings saw a 2.4 percent year-over-year gain to 463,480 in June. Of those listings, the biggest advances were in the Northeast, at 12.6 percent.
Homes spent a median of 53 days on the market, ending a period of more than two years in which homes sold more slowly than the previous year. In the Northeast, time on the market declined from last year, while the Midwest and West saw a modest uptick. Days on the market remained flat in the South.
An in-depth review of the nation’s top 50 metros showed that list prices dropped in 28 cities and increased in 22 over the past four years.
Last month’s data shows that Memphis, Tennessee, experienced the largest year-over-year price decline at 12.9 percent, with a median list price of $302,500. The median price dropped by 9.8 percent in Austin, Texas, by 9.1 percent in Buffalo, New York, and by 7 percent in Los Angeles. Still, the City of Angels carried a $1.10 million median list price in June.
Virginia Beach led the metros that posted year-over-year growth in list prices, with a 5.8 percent increase and a median of $439,100. Chicago’s median price rose by 3.8 percent and in Hartford, Connecticut, by 3.5 percent.
Overall, California’s San Jose-Sunnyvale-Santa Clara region recorded the nation’s highest median list prices in June at $1.39 million, despite a 1.0 percent year-over-year drop.
Of the metros, Pittsburgh offered the lowest median list price at just $259,900—a 1.9 percent year-over-year increase.
Krimmel predicts that July could bring even further price cuts as housing market activity traditionally slows after the spring homebuying season and buyer urgency fades.
“We'll be watching whether homes start sitting longer, whether price cuts accelerate beyond the usual summer ramp up, and whether new listings genuinely pull back or just flatten out,” he said.