Even though banks’ profits rely heavily on fee income nowadays, their clients make money by exploiting returns from holding longer-tenor (term) products. If short-tenor returns are exceptionally high, as in recent days, clients would sit on cash, and banks would have no room to profit from fee income. Given that banks and their clients’ profits align, propriety trading (selling bonds and the like) is probably the only significant revenue source independent of the long-short yield gap. Yet this usually takes up a small share of total revenue.
As a bank’s profit rate is directly proportional to the long-short yield gap, the latter should be inversely related to the severity of the run on a bank or bankruptcy; theoretically speaking, it is not simply an association but a causality. However, the yield gap is only one of the factors because this reflects only the profit “rate”—the amount made on each dollar traded. So long as the amount of business can offset the rate decline (quantity increase offsetting price fall), a bank’s earnings might still grow, and banking stock prices could perform well.
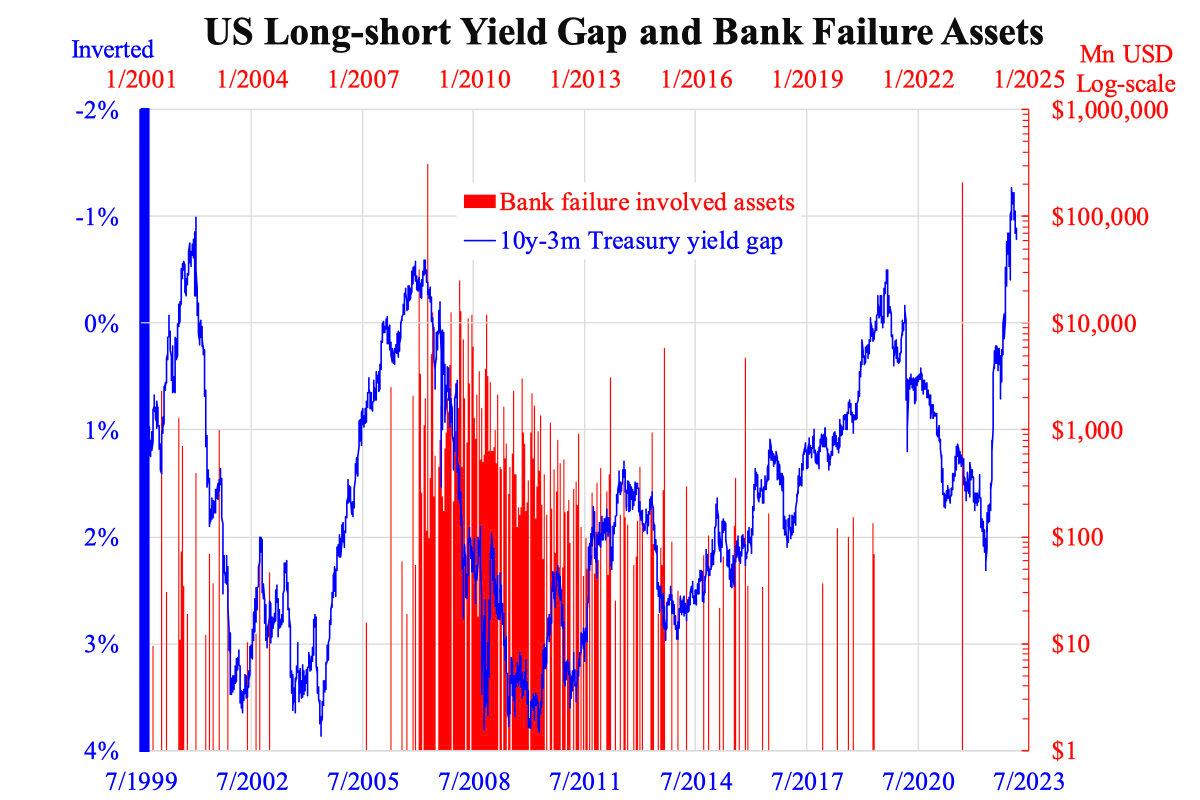
But the yield curve has been deeply inverting recently. Whether such price (profits rate) effect would outweigh the quantity effect (business amount) is an empirical question. To answer this, look at bank failures and their total assets listed by the Federal Deposit Insurance Corporation (FDIC) and chart this along with the long-short yield gap.
The accompanying chart shows this. The yield gap axis (blue on the left) is inverted, and the log-scale axis in red on the right shows the assets involved. Each red bar represents one bank failure; the denser the bars, the more frequent the closures in the period. A simple comparison suggests yield gap is a predictor of bank failure. The roughly 1.5 years time gap refers to the time from the yield gap narrowing to business and hence profits contraction, then finally to bankruptcy. Such a time gap is unstable and varies due to other factors.
This time is different because the speed of the rate hike has been much faster than any hike cycle over the past four decades, this makes the short yield surge abnormally speedy, and bank failure can happen more quickly. The yield gap has been narrowing from its widest since May 2022, adding 1.5 years gives Fall 2023. If it were to happen earlier, we would see it in the upcoming months.