SPECIAL COVERAGE
Read More


Read More
Philadelphia-Based Republic First Bank Collapses in First Bank Failure of 2024
The FDIC entered into an agreement with Fulton Financial to assume the deposits and assets of the failed bank.


When they thought all options were exhausted, precision medicine provides new hope with treatments as unique as their symptoms.
When they thought all options were exhausted, precision medicine provides new hope with treatments as unique as their symptoms.
Philadelphia-Based Republic First Bank Collapses in First Bank Failure of 2024
The FDIC entered into an agreement with Fulton Financial to assume the deposits and assets of the failed bank.


Top Premium Reads


Top Stories


Most Read
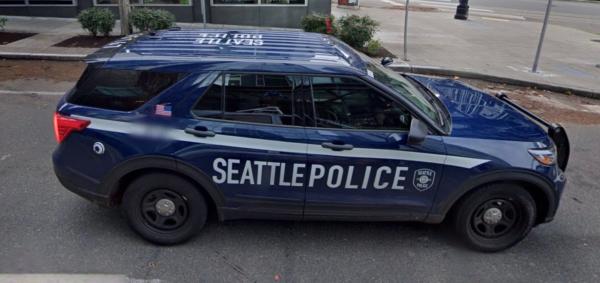
Los Angeles’s Transit System Declares Public Safety Emergency Amid Escalating Violence
Drug abuse, mental illness, and repeat offenders plaguing L.A.’s trains and buses.


Audit Finds Oklahoma Officials Mismanaged Millions in COVID Relief Funds
State Auditor and Inspector, and Attorney General claim state agency ignored competitive bidding law, steered contracts to at least one family member’s firm
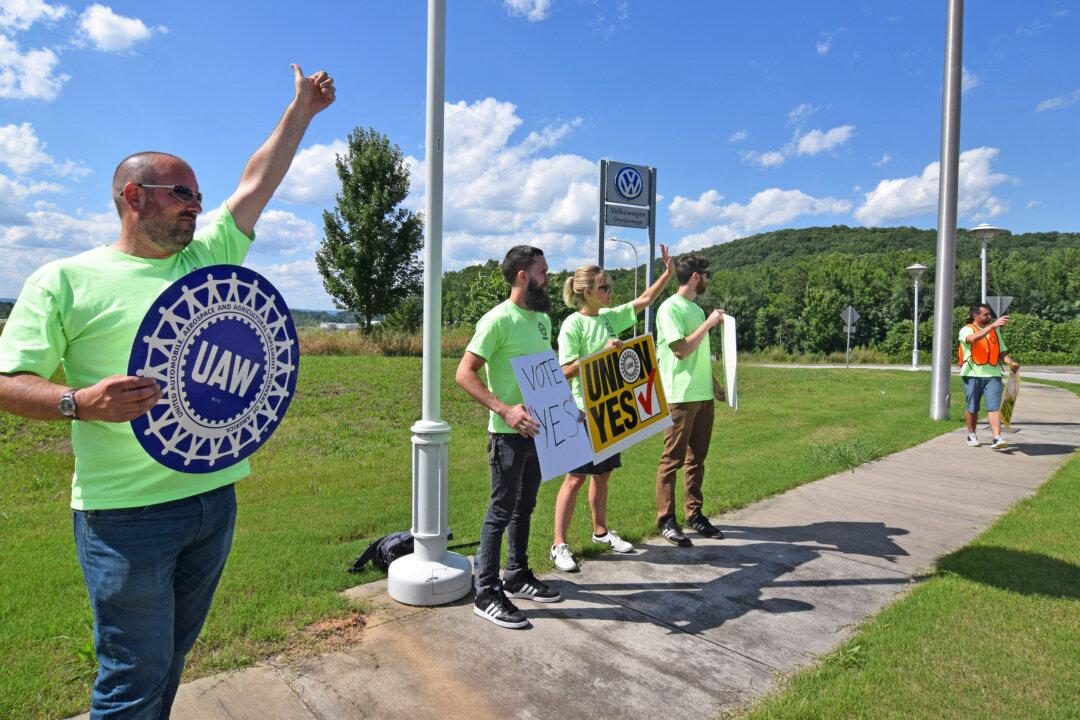
Chattanooga Volkswagen Workers Embrace Union in Historic Vote as UAW Sets Its Sights on the South
Younger workers, UAW leadership change cited as major factors in Volkswagen unionization success.

Former Rep. Meijer Drops Out of Republican Senate Race
Rep. Meijer had voted to impeach Trump in 2021.


RFK Jr. Says Kennedy Siblings Asked Biden to Give Him Secret Service Protection
The Biden administration denial of five requests for the federal security is a “political scandal,” the independent presidential candidate believes.


Trump Responds to Newsom’s Abortion Ads
Political leaders are at loggerheads over the abortion issue as the 2024 presidential election inches nearer.


House Republicans Call for Donors to Pull Funding From Columbia University Over Anti-Semitic Incidents
Lawmakers pushed for donors to withdraw support until there are clear changes in leadership.


Office Market Availability Rate Hits Record High in San Francisco
Much of the issue, experts say, is the city’s reliance on the tech industry, with more than 44 percent of its office space housing technology companies.


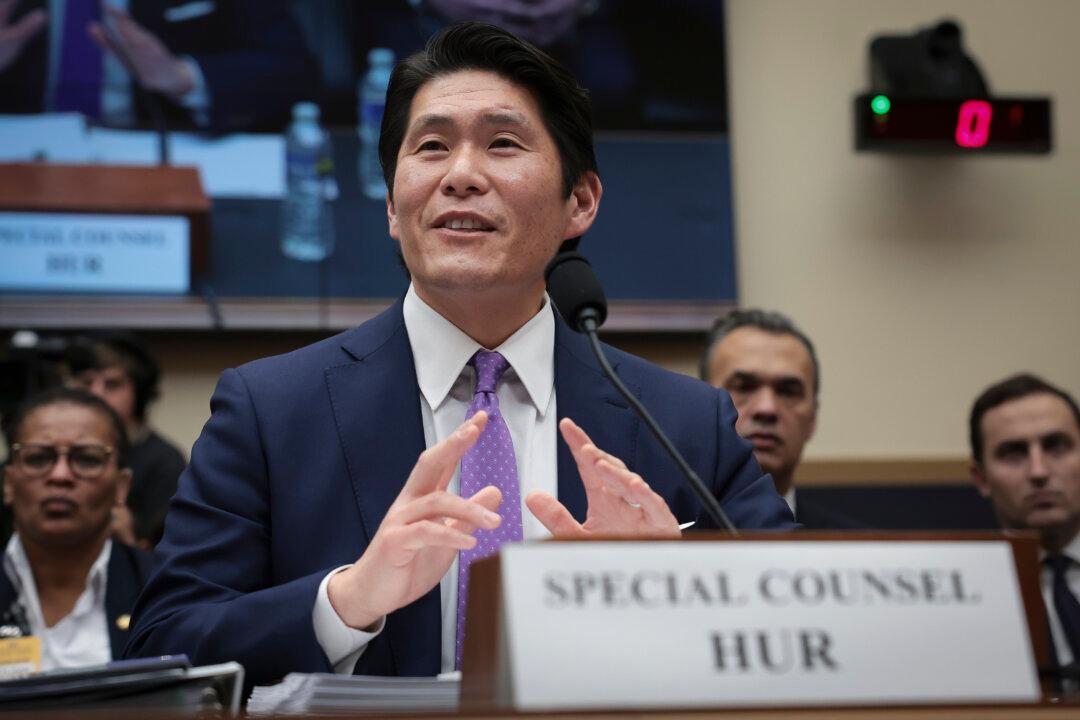
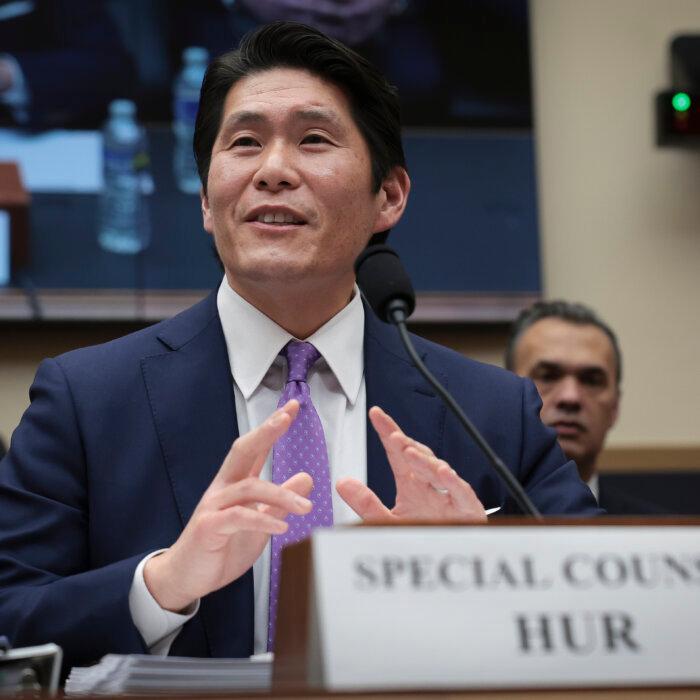
DOJ Continues to Refuse Handing Over Audio Recording of Special Counsel’s Interview With Biden
The committees have failed to articulate ‘a legitimate congressional need’ for the audio recordings, the Assistant AG said.
Editors' Picks


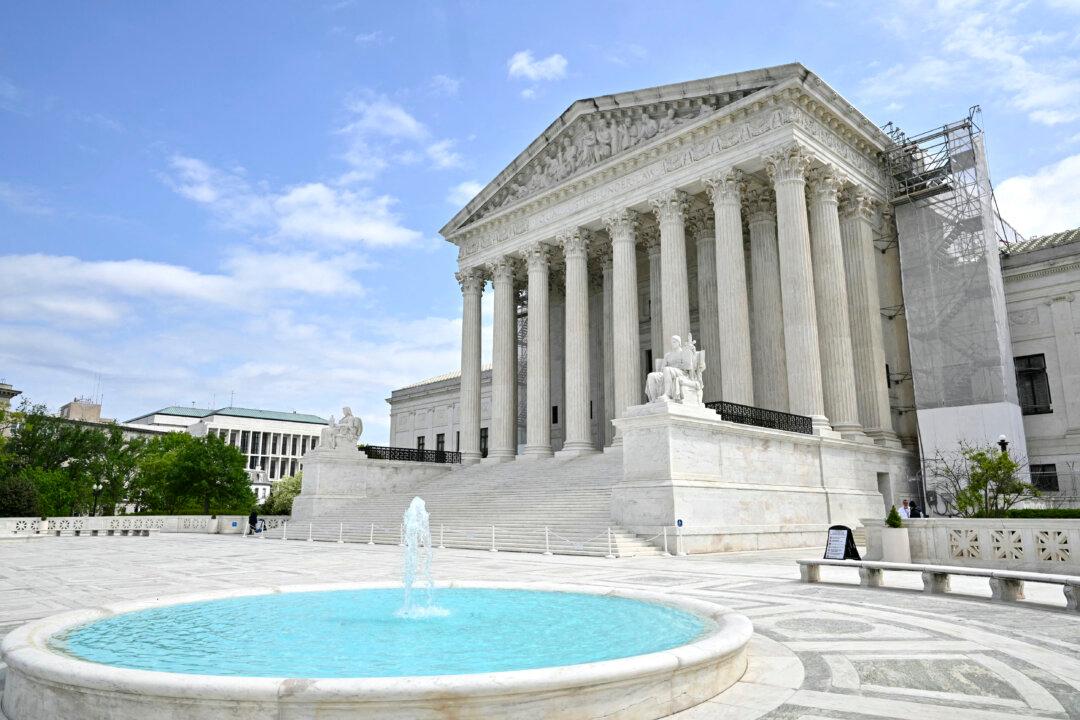
Supreme Court Seems Open to Allowing Some Presidential Immunity, May Delay Trump Trial
Justices wrestled with how to define a president’s ‘official’ versus ‘private’ acts. A decision may delay President Trump’s trial, which would hand him a win.
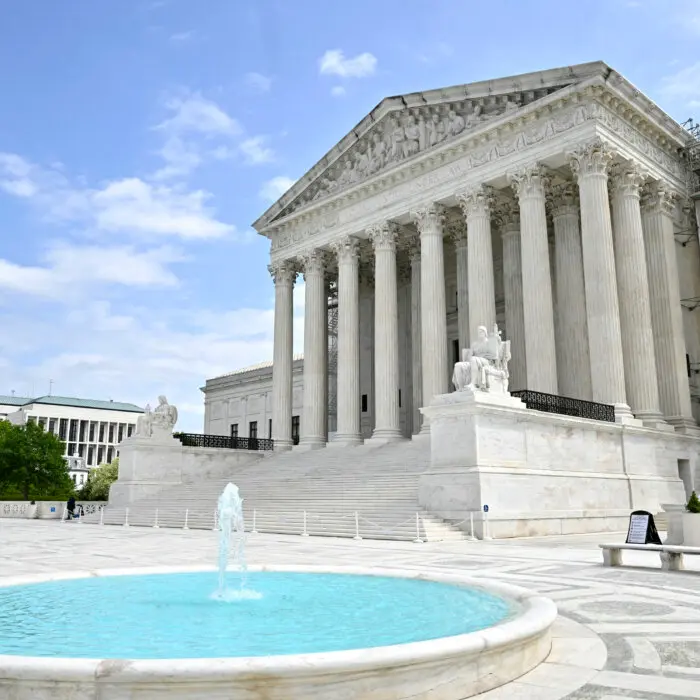


How the Supreme Court’s Immunity Decision Could Limit the Cases Against Trump
The eventual opinion could disrupt lower court proceedings and even result in another appeal that reaches the Supreme Court.


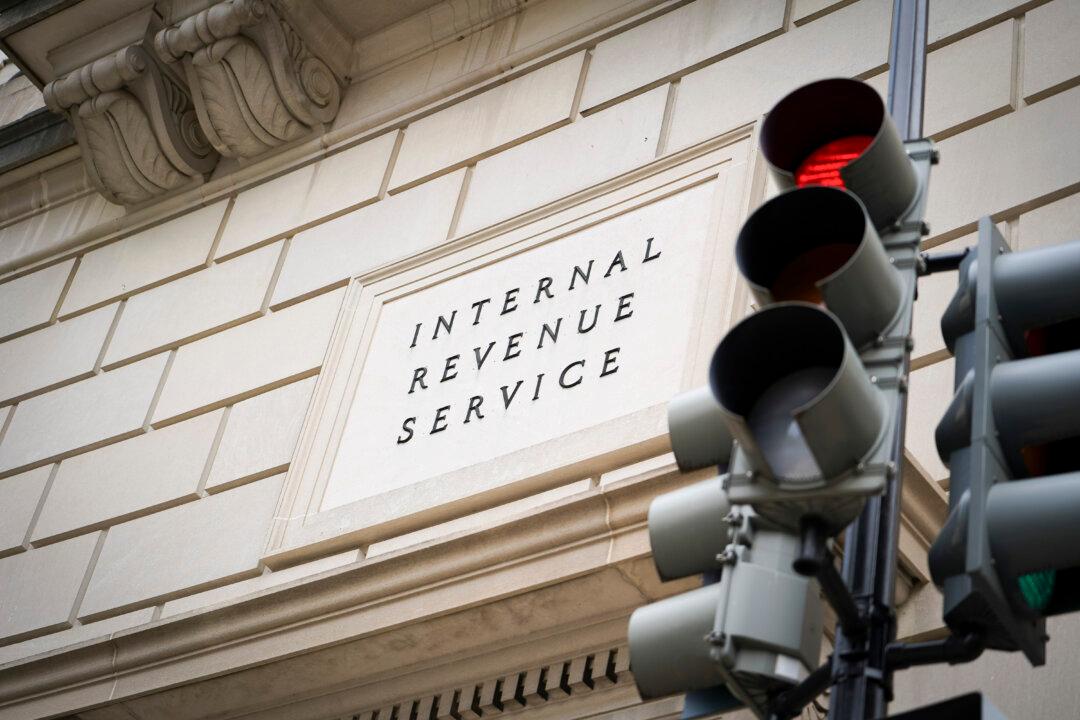
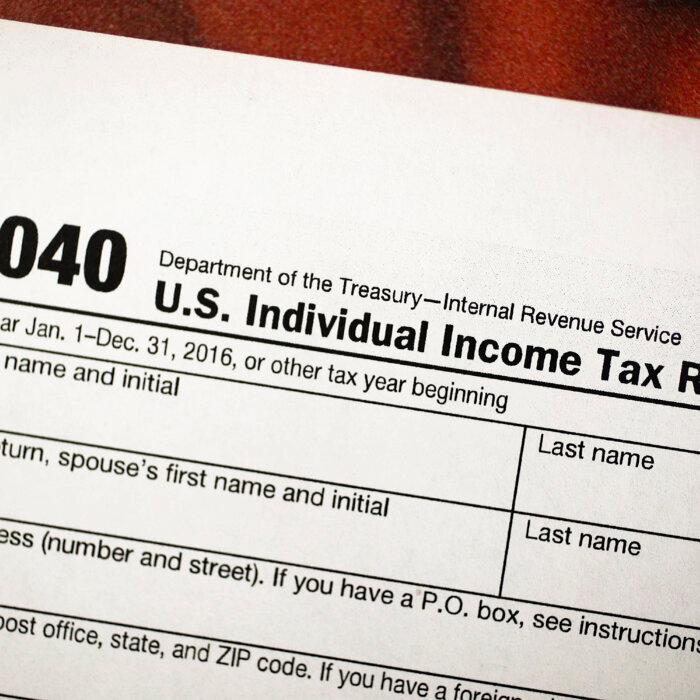
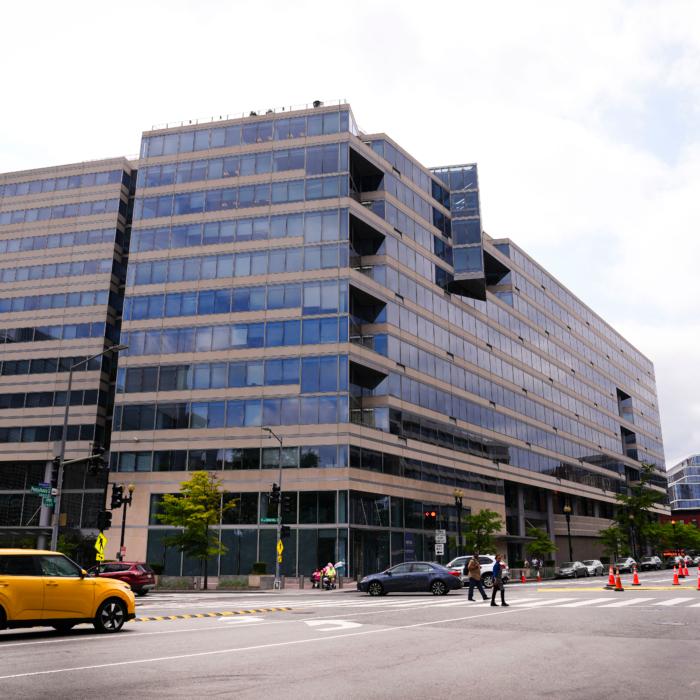
Watchdog Blasts IRS for ‘Significant Deficiencies’ That Put Sensitive Taxpayer Data at Risk
The IRS recently disclosed that it managed to rake in a near-record $4.7 trillion in taxes last year.

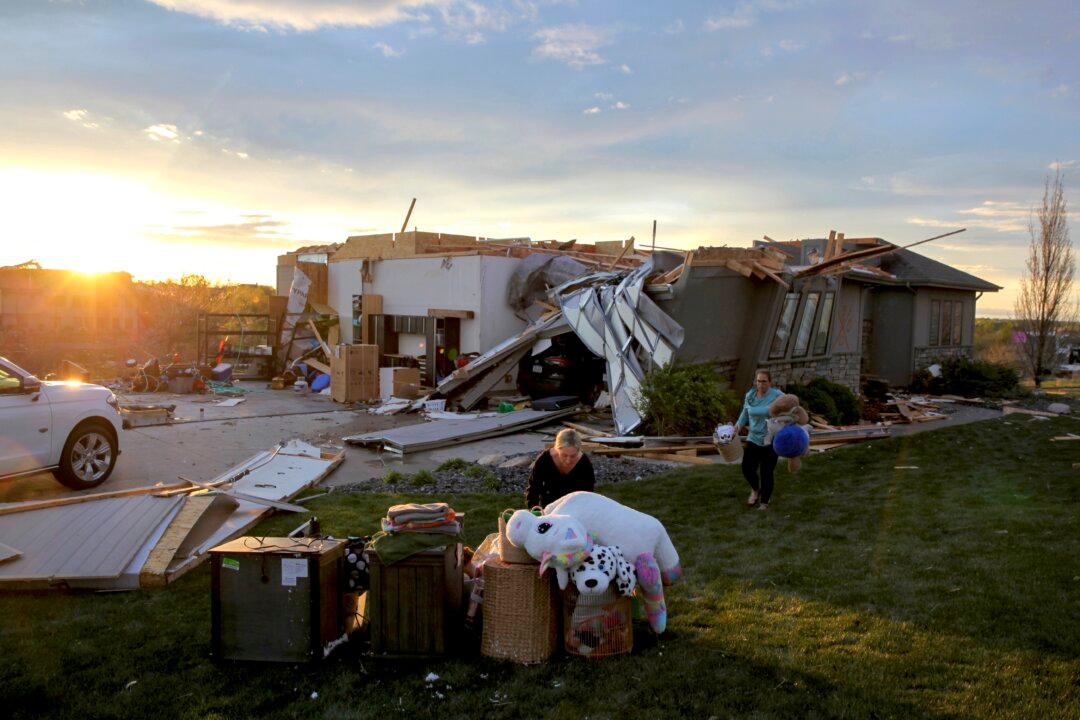
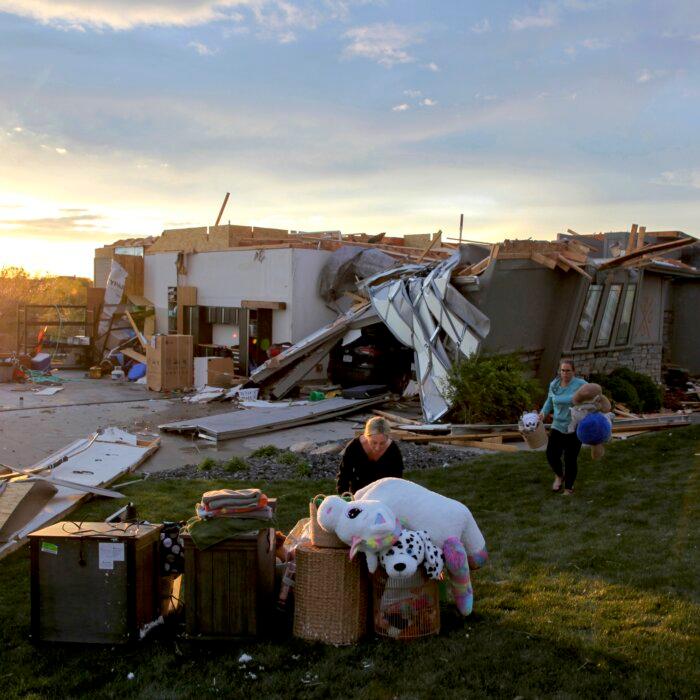
Tornadoes Strike Nebraska and Iowa, Damaging Hundreds of Houses
The suburbs northwest of Omaha, a city of 485,000 population, are among the hardest-hit regions.

How the 1939 World’s Fair Predicted Europe’s Future
In ‘This Week in History,’ ‘a valley of ashes’ becomes the site of America’s second largest World’s Fair that presents a look at the modern city.
How the 1939 World’s Fair Predicted Europe’s Future
In ‘This Week in History,’ ‘a valley of ashes’ becomes the site of America’s second largest World’s Fair that presents a look at the modern city.

Epoch Readers’ Stories
A History Of The American Nation
A patriotic poem by Ted Schneider
Of Cars and Kids
Why should our kids have to settle for a Trabant, or a Pyonghwa, education when they could have a BMW?
A Nation Divided
Poem by an American Patriot
What Is Going on Here?
There are two major things plants need to survive and continue generating our life saving oxygen. The first is CO2, and the second is sunshine.
Inspired Stories
Empower the World with Your Story: Share Love, Inspiration, and Hope with Millions


Special Coverage
Special Coverage


![[PREMIERING 4/27, 9PM ET] Shocking Number of Excess Deaths, Disabilities, and Injuries Revealed: Edward Dowd](/_next/image?url=https%3A%2F%2Fimg.theepochtimes.com%2Fassets%2Fuploads%2F2024%2F04%2F27%2Fid5638910-240426-ATL_Ed-Dowd_HD_TN-600x338.jpeg&w=1200&q=75)


Epoch Health

This Artificial Sweetener May Harm the Gut: Study
Neotame can damage the intestine and cause health issues like irritable bowel syndrome (IBS) and sepsis.


This Artificial Sweetener May Harm the Gut: Study
Neotame can damage the intestine and cause health issues like irritable bowel syndrome (IBS) and sepsis.
Bright
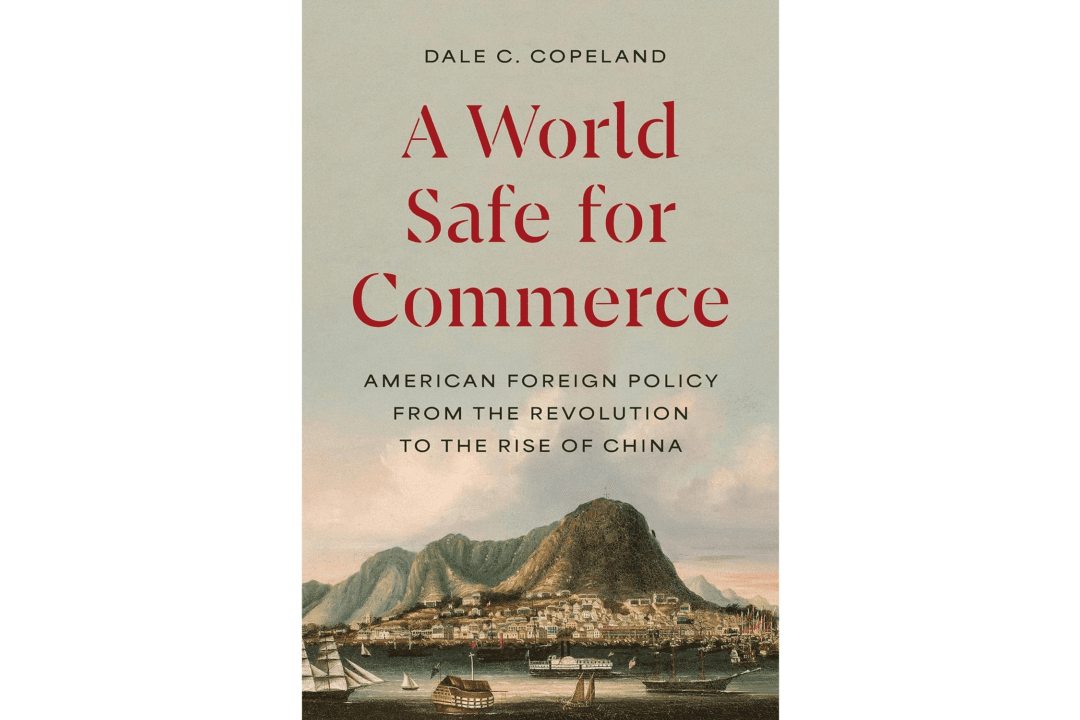
Dealing With China via America’s Commercial History
In ‘A World Safe for Commerce,’ Dale Copeland presents America’s 250-year geopolitical history to show a possible working theory for how to deal with China.

The Mighty Five and the Birth of Russian Music
How did the soulful character of Russian music, distinguishable from other European nations, evolve?

‘Cry Freedom’: A Crusade Against South Africa’s Apartheid
This biopic focuses on two South Africans who oppose their country’s apartheid.

‘In the Land of Saints and Sinners’: A Powerful Irish Tale
Like Brad Pitt’s line in ‘The Devil’s Own’: ‘It’s not an American story—it’s an Irish one,’ ‘Saints and Sinners’ features an all-Irish cast doing IRA things.

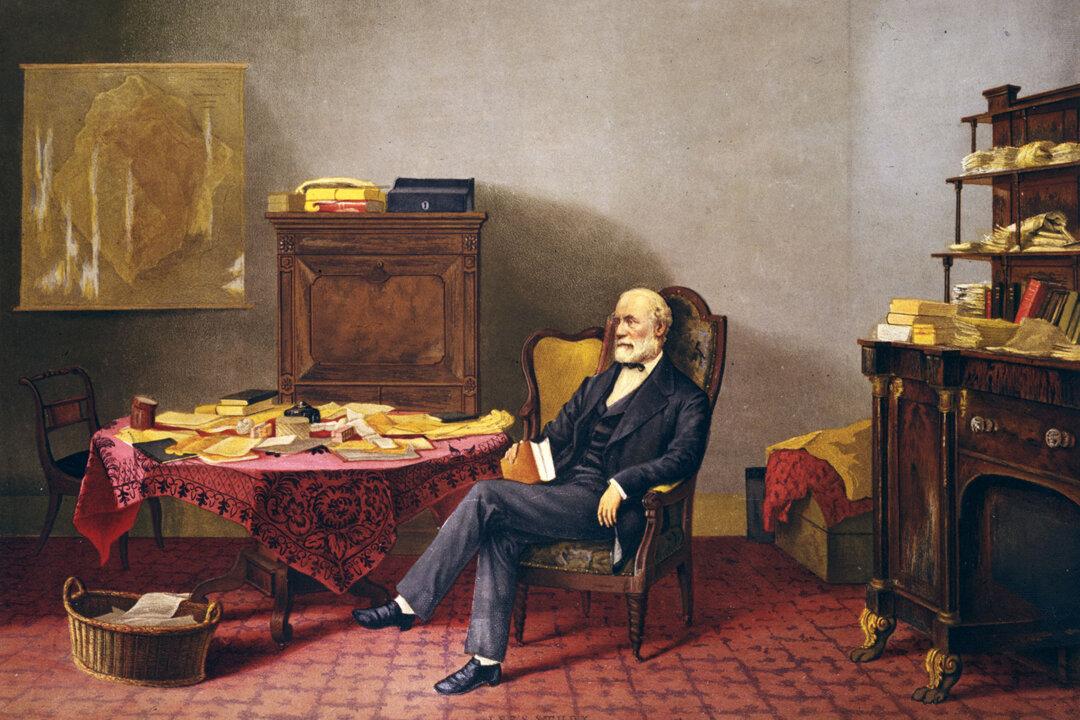
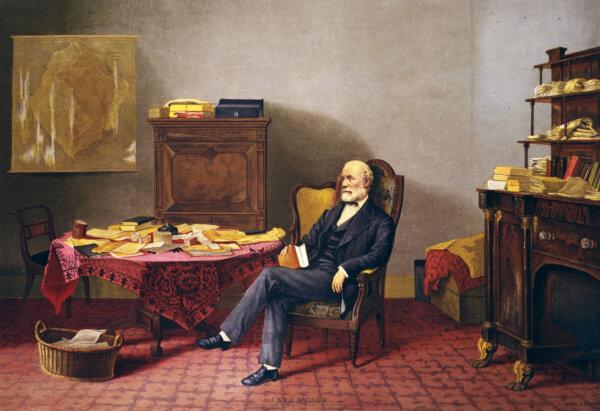
The Two Reputations of Robert E. Lee
While those in the past saw Lee’s stellar qualities, today, some cannot see that he was a man defined, like all of us, by his time.

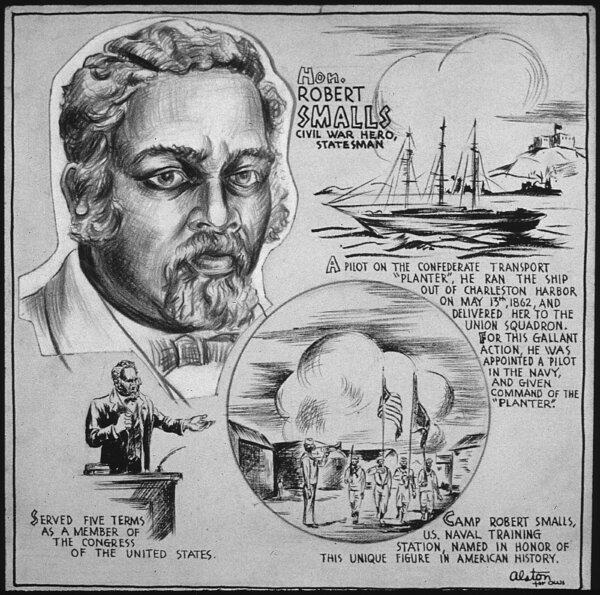
Robert Smalls: Navy Captain and Reconstruction-Era Politician
This former slave would not let anything stop him on the road to freedom.


Dealing With China via America’s Commercial History
In ‘A World Safe for Commerce,’ Dale Copeland presents America’s 250-year geopolitical history to show a possible working theory for how to deal with China.


The Best Recipes Are Made From Shopping Your Fridge
Cottage cheese in the fridge is inspiration to make cheese dumplings.


Charming Georgia Town a Treat for ‘Flanatics’ of Celebrated Southern Writer O’Connor
Andalusia farm gave O'Connor the environment to write her books.

Michigan Lawmakers Try to Put Brakes on Mackinac Island’s E-bike Riders
Mackinac Island doesn’t have cars but the speed of e-bikes are becoming a problem.

Taking the Kids: To the Smithsonian Museums
The Smithsonian Institution is the world’s largest museum, education and research complex.

Charming Georgia Town a Treat for ‘Flanatics’ of Celebrated Southern Writer O’Connor
Andalusia farm gave O'Connor the environment to write her books.