Most people who wrote books about the stock market around the year 2000 titled them something like “Dow 40,000.”
Not so Yale professor Robert Shiller. He wrote a book called “Irrational Exuberance,” which came out in March of 2000, said the market was grossly overvalued and will decline and only missed the top in the Nasdaq Composite index by five days.
When asked about the current market valuation by CNBC, Shiller said the Dow Jones could drop to 11,000 and the S&P 500 to 1,300 if markets were to revert to the average of his long-term Cyclically Adjusted Price Earnings Ratio.
“The CAPE ratio is still at 25, it’s high. The ordinary price earnings ratio is misleading because earnings can drop precipitously during a recession and they are volatile from year to year,” Shiller told CNBC. The CAPE takes the 10 year rolling average of company earnings and adjusts them for producer price inflation.
The ratio reached a high of 44 in early 2000 but also marked important tops in 2007 and in the bear market of 1960.
“The market is high now. … The recent turmoil is making many people think and see whether there exposure to the market is right. Some people are surely overexposed and ought to reconsider,” said Shiller.

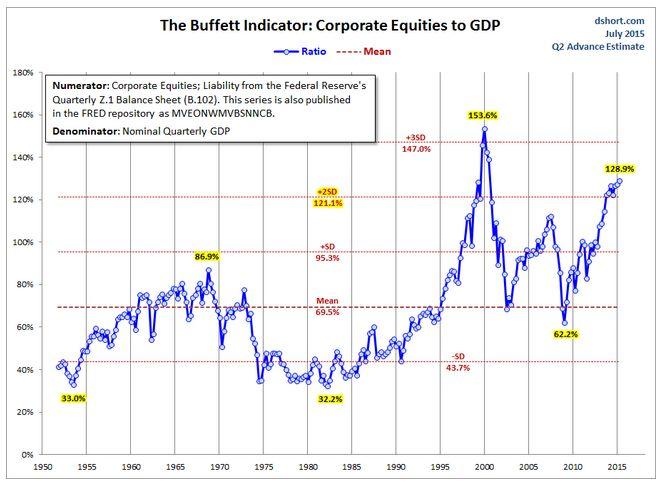
Other longer term valuation indicators have been in red hot territory as well. The total market value to GDP ratio, a favorite indicator of Warren Buffett, has hovered around 130 for the last year. It reached a record (again in 2000) of 150, but hasn’t exceeded 130 during other periods.
Another long-term indicator is the Tobin Q ratio, named after economist James Tobin. It is the ratio between the market valuation of companies and the book valuation of companies. If the market valuation is higher than the book valuation, it makes more sense to buy assets at book value to growth the business, rather than buying stocks.
The ratio topped out at 1.09 (meaning the market is 9 percent more expensive than the book value of the companies), a level that has signaled previous cycle tops as well.
But even the current price earnings ratio for the S&P 500 taking the previous year’s earnings is not cheap. It is currently at 19.80, about 20 percent higher than the average of 15.55.
The problem for all these valuation indicators is the following. If they top out the market enters a cyclical decline, they won’t just revert to the average. They will go into oversold territory, meaning the Dow could drop much further than the 11,000 Robert Shiller has in mind.