Floating softly through the vacuum of space, the Landsat 7 satellite has faithfully provided imaging of the entirety of earth’s surface, every 16 days, since 1999. Now a series of technological developments has made this silent spectator a dominant force in tracking forests worldwide. From his personal computer in Redwood City, California, Rhett Butler, founder and director of mongabay.com, identified an area of recent deforestation on the island of Sumatra. In less than 72 hours, he was bumping along a freshly cut logging road in a 4x4 Jeep, following his GPS to the coordinates of the identified forest loss. Rounding a hill, Butler came face to face with a massive clearing, oil palm seedlings already planted amidst the ruins of the freshly cut forest.
Global Forest Watch (GFW), launched in February of 2014, is an online forest monitoring and alert system pioneered by the World Resources Institute in partnership with over 40 other organizations, including Google, Esri and the United Nations Environment Program. This platform allows for innovative transparency in tracking forest loss and re-growth, providing yearly tree cover change data from 2001-2012, available to anyone, at no cost, anywhere in the world.
One of the main datasets mapped by GFW comes from the 2013 study “High-Resolution Global Maps of 21st-Century Forest Cover Change,” published by Matthew Hansen and colleagues in the journal Science. This massive dataset consists of over 600,000 individual images provided by the Landsat 7 satellite, and involved monumental computations made possible by a partnership with the Google Earth Engine team. The current GFW platform allows users to analyze user-defined areas for changes in forest extent using cloud-based servers, allowing for easy access to and customizability of this enormous dataset.
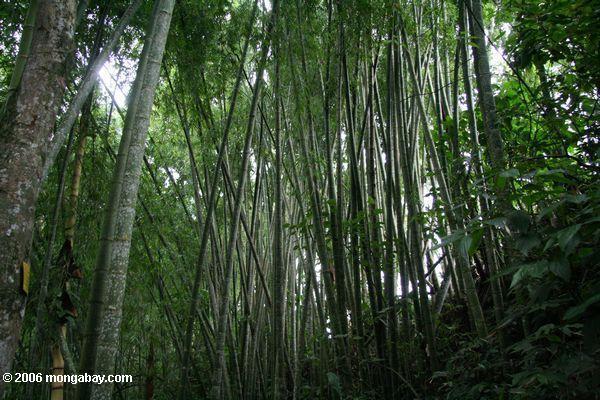
Still, criticisms have been raised, largely focused around how forests were defined. Hansen and his team used an algorithm to distinguish forest cover from other surface types that defines “forest” as vegetation over five meters (16 feet) in height. This definition does not differentiate between old growth forests and monoculture timber plantations, which provide vastly divergent biodiversity levels and ecosystem services. The area mapped as “tree cover” on the GFW platform includes eucalyptus plantations and even oil palm plantations, the expansion of which is driving deforestation in Indonesia. According to some critics, this conflation of forests with plantations has the potential for abuse by local policy makers, who stand to gain from getting credited with pro-forest policies while expanding lucrative oil palm plantations.
The existing confusion in forest definitions may have serious implications for governments and decision makers. “In Indonesia there has been a real political debate on what the real numbers are,” said Dr. Fred Stolle of WRI in an interview with mongabay.com. A recent study in Nature Climate Change published by researchers at the University of Maryland and the World Resources Institute (two leading partners in GFW) had found increasing levels of deforestation in primary forests, which conflict with the Indonesian National Forestry Ministry’s reports of a decreasing trend in forest loss. Three high-level roundtables were convened to debate the matter, with representatives from the Indonesian government, University of Maryland, WRI and others present. The debate remains unresolved.
The delicate nature of this forest definition game was made evident in 2000 when the Food and Agriculture Organization, an agency of the United Nations, changed its forest definition to a uniform definition across developing and developed nations in anticipation of the global Forest Resource Assessment. This change resulted in an additional 300 million hectares, or an increase in global forest levels of about 10 percent.
Instead of aligning itself with any specific forest definition, GFW has decided to provide open access to these data while clearly stating how each dataset is defined.
“We aim to provide a platform that can host a wide variety of information on forests, and make all that information transparent and accessible to everybody,” said WRI’s communications officer James Anderson. This flexible approach allows GFW to provide data while leaving its interpretation open to local perceptions. Anderson explained, “Maybe the solution is not always a single global definition, because values differ from place to place, and forests are just so different across the world. So the way in which we measure and monitor them needs to be different in different places.”
Anderson emphasized how important it is for users to understand just what is shown on the maps they are looking at. “Reading the fine print is important! Misinterpretation is definitely a danger, but it’s always been a danger, even before GFW,” he said. “GFW has put this data out there in a way that’s never been seen before. I think it’s good and healthy for us to have a dialogue about that.”
These are critical times for the world’s forests, highlighted by the recent UN climate summit in New York. One of its components, the New York Declaration on Forests, included a call to cut deforestation in half by 2020, and altogether by 2030, as well as restore an area larger than India by 2030.
As the world awakens to the importance of its forests, the need for a clear understanding of those forests becomes more pertinent. “We’ve made a lot of changes in just the past few months,” Anderson said. “We now have access to more and more high-resolution imagery. Meeting these commitments means forest change needs to be measured clearly.”
Citations:
- Hansen, M. C., Potapov, P., Moore, R., Hancher, M., Turubanova, S. A., Tyukavina, A., … Townshend, J. R. G. (2013). High-Resolution Global Maps of 21st-Century Forest Cover Change. Science, 850(342), 850–853.
- Hansen, M. (2014). Response to Comment on “High-resolution global maps of 21st-century forest cover change.” Science, 981(344).
- Putz, F. E., & Romero, C. (2014). Futures of Tropical Forests ( sensu lato ). Biotropica, 46(4), 495–505.
- Sasaki, N., & Putz, F. E. (2009). Critical need for new definitions of “forest” and “forest degradation” in global climate change agreements. Conservation Letters, 2(5), 226–232.
- Margono, B. A., Potapov, P. V, Turubanova, S., Stolle, F., & Hansen, M. C. (2014). Primary forest cover loss in Indonesia over 2000-2012. Nature Clim. Change, 4(8), 730–735. Retrieved from http://dx.doi.org/10.1038/nclimate2277
- Martin Persson, Sabine Henders, and Thomas Kastner. 2014. “Trading Forests: Quantifying the Contribution of Global Commodity Markets to Emissions from Tropical Deforestation.” CGD Working Paper 384. Washington, DC: Center for Global Development. http://www.cgdev.org/publication/trading-forests-quantifying-contribution-global- commodity-markets-emissions-tropical
- Tropek, R., Sedláček, O., Beck, J., Keil, P., Musilová, Z., Símová, I., & Storch, D. (2014). Comment on “High-resolution global maps of 21st-century forest cover change”. Science (New York, N.Y.), 344(6187), 981.
This article was written by Julian Moll-Rocek, a correspondent for news.mongabay.com. This article was republished with permission, original article here.