

Recession indicators are becoming more insistent.
Yet, the Federal Reserve remains focused on its inflation fight. As noted in “No Landing Scenario,” the Fed maintains a “hawkish” bias despite the markets not listening. As such:
• “I wouldn’t rule out supporting a 50 basis-point March hike,” said James Bullard, president of the Federal Reserve Bank of St. Louis. • “The Fed risks a replay of the 1970s if it can’t lower inflation soon,” said Bullard. • “At this point, I see the policy rate in the range of 5.25 percent to 5.5 percent as appropriate,” said Bullard. • “The return to price stability will be painful,” said Bullard. • “It’s not always going to be, you know, 25 [basis points],” said Loretta Mester, president of the Federal Reserve Bank of Cleveland. • “As we showed, when the economy calls for it, we can move faster. And we can do bigger increases at any particular meeting,” said Mester.
This type of rhetoric certainly doesn’t support the idea that Fed will cut rates soon. However, as discussed previously, the lag effect of rate hikes remains the most significant risk.
The problem between the bears and the bulls is that the economy still shows plenty of strength, from recent employment numbers to retail sales. However, much of this “strength” is an illusion from the pull forward of consumption following the massive fiscal and monetary injections into the economy.
As shown, M2, a measure of monetary liquidity, is still highly elevated as a percentage of GDP. This “pig in the python” is still processing through the economic system. Still, the massive deviation from previous growth trends will require an extended time frame for reversion. This is why calls for a recession have been early, and the data continue to surprise economists.
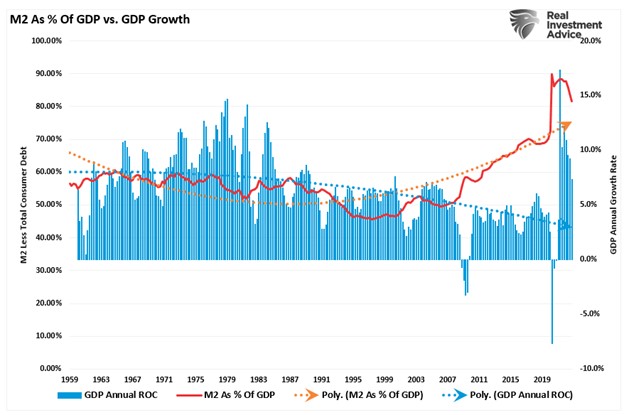
(Source: Federal Reserve Bank of St. Louis / Refinitiv chart: RealInvestmentAdvice.com)
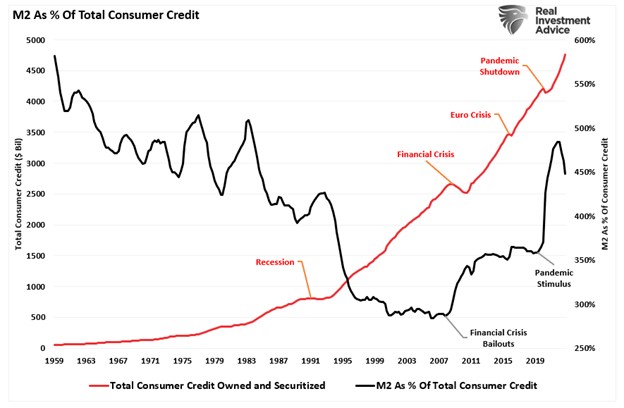
Given that economic growth is comprised of roughly 70 percent consumer spending, the ramp-up in debt to “make ends meet” as that liquidity impulse fades is not surprising. You will note that each time there is a liquidity impulse following some crisis, consumer debt temporarily declines. However, as we said previously, the inability to sustain the current standard of living without debt increases is impossible. Therefore, as those liquidity impulses fade, the consumer must take on increasing debt levels.
Monetary and Fiscal Policy Is Deflationary
The problem is that the Federal Reserve and the federal government fail to grasp that monetary and fiscal policy is “deflationary” when “debt” is required to fund it.How do we know this? Monetary velocity tells the story.
What is “monetary velocity”?
According to a definition in Investopedia: “The velocity of money is important for measuring the rate at which money in circulation is used for purchasing goods and services. Velocity is useful in gauging the health and vitality of the economy. High money velocity is usually associated with a healthy, expanding economy. Low money velocity is usually associated with recessions and contractions.”
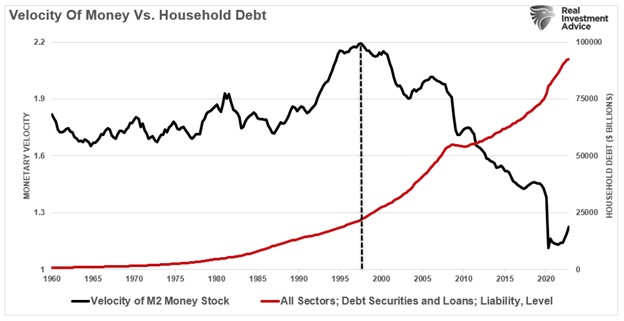
(Source: Federal Reserve Bank of St. Louis / Refinitiv chart: RealInvestmentAdvice.com)
With each monetary policy intervention, the velocity of money has slowed along with the breadth and strength of economic activity.
While in theory “printing money” should lead to increased economic activity and inflation, this has not been the case.
As shown, beginning in 2000, the money supply as a percentage of GDP has exploded higher. The surge in economic activity is due to reopening from an artificial shutdown.
Therefore, the growth is only returning to the long-term downtrend. The attendant trendlines show that increasing the money supply has not led to more sustainable economic growth. It has been quite the opposite.
However, it isn’t just the expansion of the Fed’s balance sheet that undermines the economy’s strength. For instance, it is also the ongoing suppression of interest rates to try and stimulate economic activity. In 2000, the Fed crossed the Rubicon, whereby lowering interest rates did not stimulate economic activity. Therefore, the continued increase in the debt burden detracted from it.
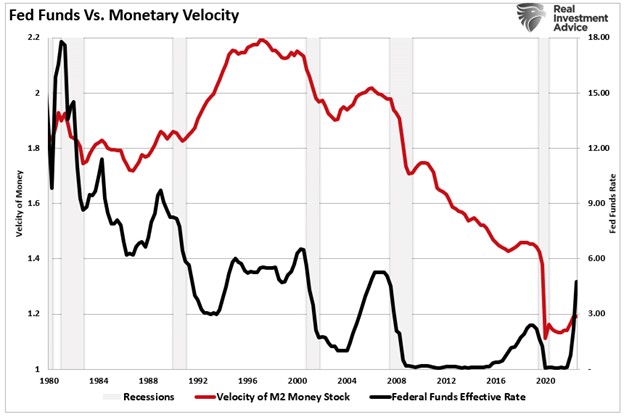
(Source: Federal Reserve Bank of St. Louis / Refinitiv chart: RealInvestmentAdvice.com)
Recession Indicators Ringing Alarm Bells
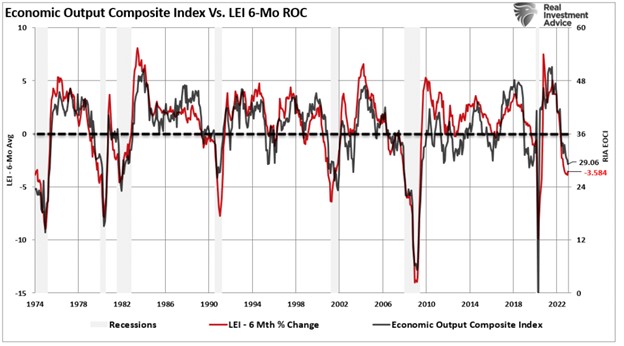
Many recession indicators are ringing alarm bells, from inverted yield curves to various manufacturing and production indexes. However, for this post, we will focus on two that correlate to economic expansions and recessions.The first is our composite economic index comprising more than 100 data points, including leading and lagging indicators. Historically, when that indicator has declined below 30, the economy was either in a significant slowdown or recession. Just as inverted yield curves suggest that economic activity is slowing, the composite economic index confirms the same.
(Source: Federal Reserve Bank of St. Louis / Refinitiv chart: RealInvestmentAdvice.com)
The six-month rate of change of the Leading Economic Index (LEI) also confirms the composite economic index. As a recession indicator, the six-month rate of change of the LEI has a perfect traffic record.
(Source: Federal Reserve Bank of St. Louis / Refinitiv chart: RealInvestmentAdvice.com)
Of course, today’s debate is whether these recession indicators are wrong for the first time since 1974. As stated above, the massive surge in monetary stimulus (as a percentage of GDP) remains highly elevated, which gives the illusion the economy is more robust than it likely is. As the lag effect of monetary tightening takes hold later this year, the reversion in economic strength will probably surprise most economists.
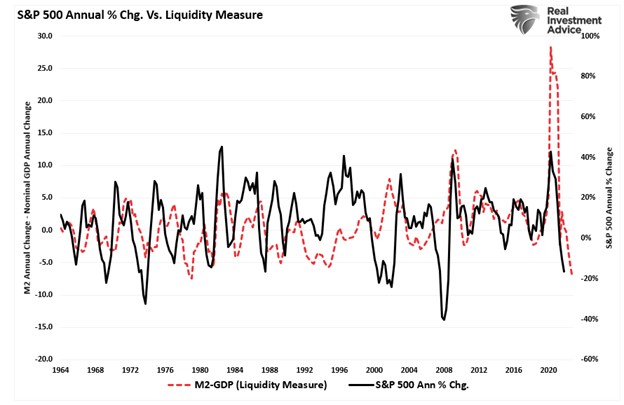
For investors, the implications of reversing monetary stimulus on prices are not bullish. As shown, the contraction in liquidity, measured by subtracting GDP from M2, correlates to changes in asset prices. Given there is significantly more reversion in monetary stimulus to come, this suggests that lower asset prices will likely follow.
(Source: Federal Reserve Bank of St. Louis / Refinitiv chart: RealInvestmentAdvice.com)
The Fed Will Hike Until It Breaks Something
As the Fed continues to hike rates to fight an inflationary boogeyman, the more considerable threat remains deflation from an economic or credit crisis caused by over-tightening monetary policy.History is clear that the Fed’s current actions are once again behind the curve. While the Fed wants to slow the economy, not have it come crashing down, the real risk is that something breaks. Each rate hike puts the Fed closer to the unwanted event horizon. When the lag effect of monetary policy collides with accelerating economic weakness, the Fed’s inflationary problem will transform into a more destructive deflationary recession.
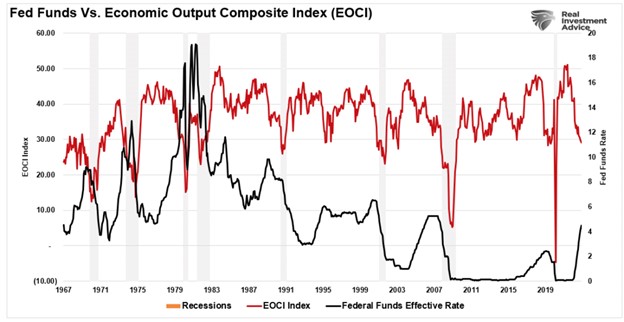
If we overlay periods of Federal Reserve tightening over our economic composite recession indicator, the risk becomes quite clear.
(Source: Federal Reserve Bank of St. Louis / Refinitiv chart: RealInvestmentAdvice.com)
While the Fed is hiking rates due to inflationary concerns, the real risk becomes deflation when something breaks.
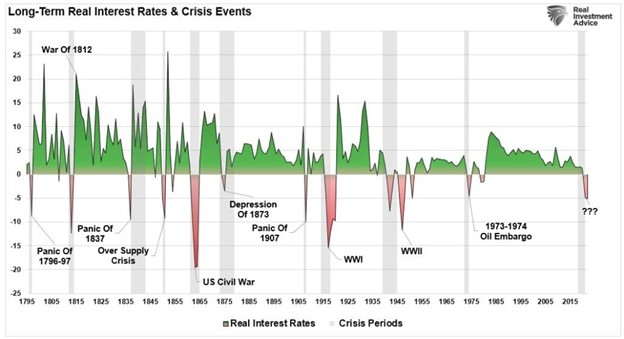
This is because high inflationary periods also correspond with higher interest rates. In highly indebted economies, as in the United States today, this creates faster demand destruction as prices and debt servicing costs rise, thereby consuming more of available disposable income. The chart below shows real interest rates, which include inflation, going back to 1975.
(Source: Federal Reserve Bank of St. Louis / Refinitiv chart: RealInvestmentAdvice.com)
Not surprisingly, each period of high inflation is followed by very low or negative inflationary (deflation) periods.
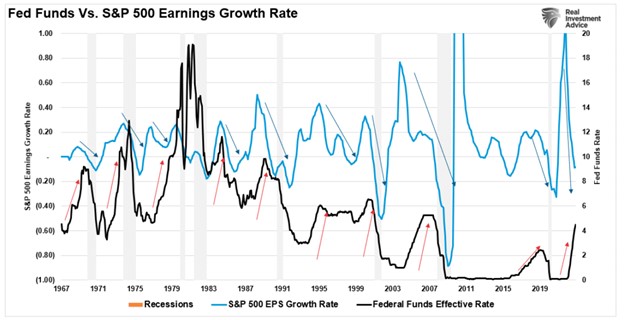
For investors, these recessionary indicators confirm that earnings will decline further as tighter monetary policy slows economic growth.
Historically, periods of Fed tightening have never had a positive outcome on earnings, and it likely won’t this time either. That is particularly the case when the Fed “breaks” something.
While this time “could be different,” from an investing standpoint, I wouldn’t bet my retirement on that view.


