If temperatures hit unseasonable highs this fall and winter, blame El Niño, not fossil fuels, a group of climate analysts says.
Flying in the face of the prevailing narrative on climate change, a recent report on El Niño argues that the Pacific weather phenomenon corresponds more closely than CO2 emissions to shifting temperature patterns and is the more likely cause of temperature changes.
“El Niño is happening now; it will get warmer; we will see some record temperatures; we will see some additional weather related to it,” climate analyst and meteorologist Anthony Watts told The Epoch Times. “Significant increases will begin in the fall or early winter, which is typically the time that this phenomenon peaks.”
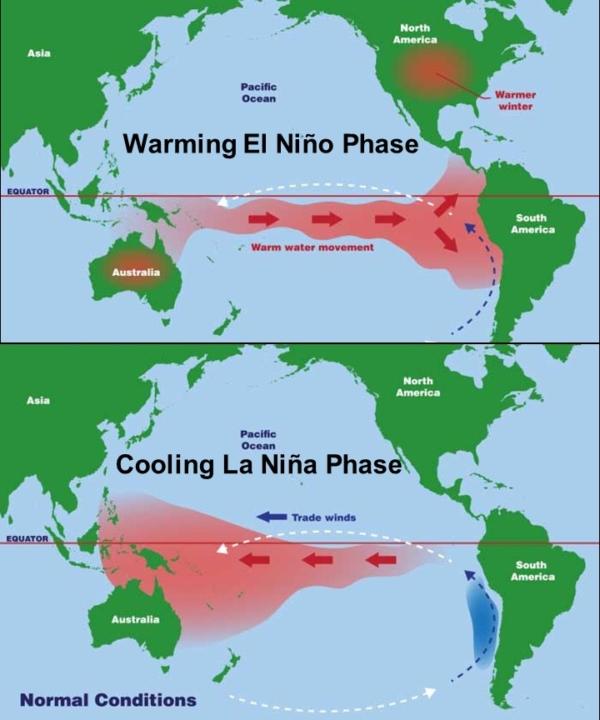
El Niño refers to a warming trend in the Pacific Ocean, leading to warmer temperatures in North and South America that can last as long as several years. La Niña is the reverse of this process.
“El Niño is a natural event; it’s driven by changes in winds at the equator,” Watts said. “Basically, what happens is that it roughs up the surface of the ocean, which allows the surface to absorb more solar radiation, and therefore warm up. So it’s entirely a physical mechanism based on winds.”
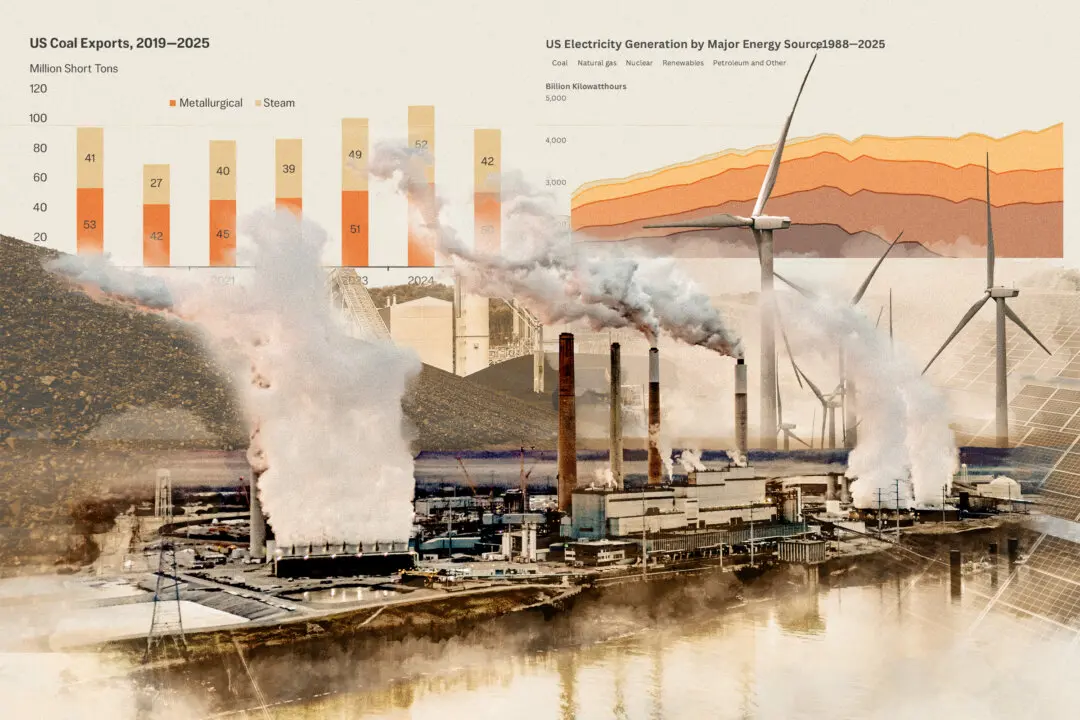
The climate change narrative, by contrast, argues that higher temperatures are caused by CO2 emissions, primarily from burning fossil fuels, which trap heat in the earth’s atmosphere. These emissions have been rising steadily over the past century, and average temperatures have also increased over this period. But some experts say the correlation isn’t as convincing as climate change advocates claim.
“While it doesn’t influence a large part of the world, it does seem to have significant influence on temperature,” Greg Wrightstone, a geologist and the executive director of the CO2 Coalition, said.
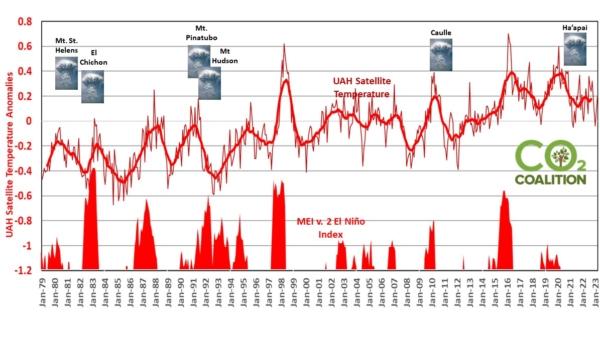
Analyzing temperatures compared with El Niño activity and atmospheric CO2 levels shows that “while CO2 continues to increase at a pretty steady rate, [temperature] spikes don’t seem to be driven at all by CO2-driven warming,” Wrightstone said. “Virtually all of these El Niño events drive global temperature spikes,” typically with a lag of several months.
“The only exception, interestingly, is 1991 to 1995,” he said. “We had a strong El Niño, and it looks like it was canceled out with the eruptions of Mount Pinatubo and Mount Hudson, which have a cooling effect. ”
“We had a number of strong El Niño events in the last 20 to 30 years, in particular, the 1998 and the 2015–2016 El Niño,” Watts said. “Both of those events caused a dramatic warming of the Pacific, and that warming gradually spread out across the globe.
“But when we were in a La Niña pattern, since 2015, temperatures dropped significantly and globally. And so, that does not correlate with CO2 being the main driver of temperature. We would not see a global cooling from 2015 to the present.”
“We were in a cooling trend from the mid-‘40s until the late ’70s, all while CO2 levels increased,” Wrightstone said. “That period from the late ‘40s to the late ’70s was La Niña-dominated cooling. And then just as we started getting into an El Niño-driven period, we went into this warming term period from the late 1970s until today.”
According to Steve Milloy, a senior fellow at the Energy and Environment Legal Institute, the “global warming narrative” states that “because emissions cause and drive warming, and emissions are bad, all emissions must be eliminated and we must get to net zero.”
“We have put 500 million tons of emissions into the atmosphere since 2015,” Milloy said. “This is a 17 percent increase in industrial era CO2 since 2015, but there’s been no warming.
“In fact, it’s been slightly cooler. And the reason for this [is] there’s been a series of El Niños since 1908. El Ninos drive temperatures up, and then temperatures basically drift down until the next El Niño.”
Many advocates of the climate change narrative point out that the trend over the past century does show a long-term pattern of rising temperatures, despite short-term fluctuations. According to the National Oceanic and Atmospheric Administration (NOAA), a federal scientific and regulatory agency, average global surface temperatures have increased by 2 degrees Fahrenheit (1 degree Celsius) since 1880.
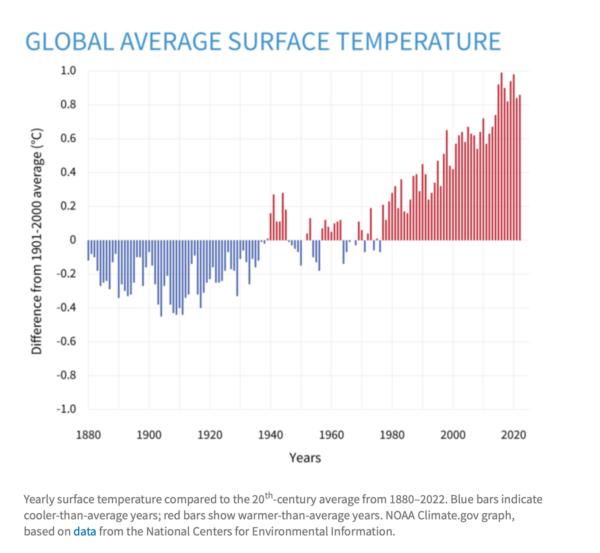
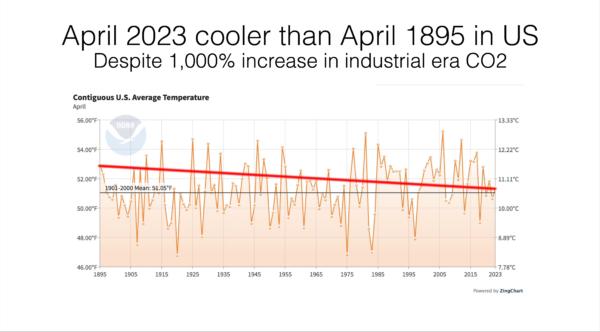
But James Taylor, director of the Heartland Institute’s Center for Climate and Environmental Policy, said that much of the global warming narrative is based on a selective analysis of global temperature data. Indeed, while the two temperature graphs showing average temperatures since the late 1800s look dramatically different, they are based on data from the same source, the NOAA, although the vertical axes use different units.
“When you hear the term, ‘the hottest years on record,’ it’s because they conveniently defined the record as just the past 100 years,” he said. “Climate activists are dishonestly attempting to lead people to believe that these are the hottest temperatures ever in human civilization. It’s simply not the case.”
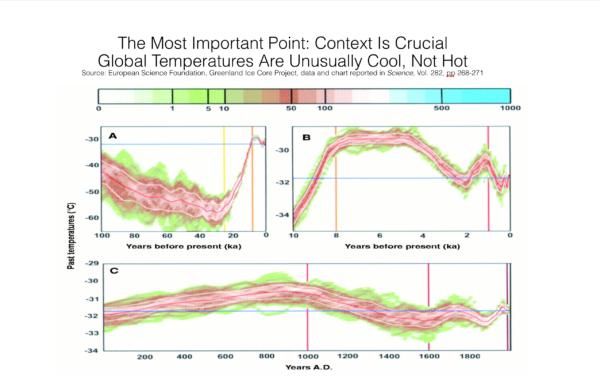
Taylor cited peer-reviewed data from the European Science Foundation showing global temperatures over the past 2,000 years, in which “you see a minor increase in temperatures as all the warming of the past 150 years.” He also cited data from the U.N. Intergovernmental Panel on Climate Change, which show similar trends.
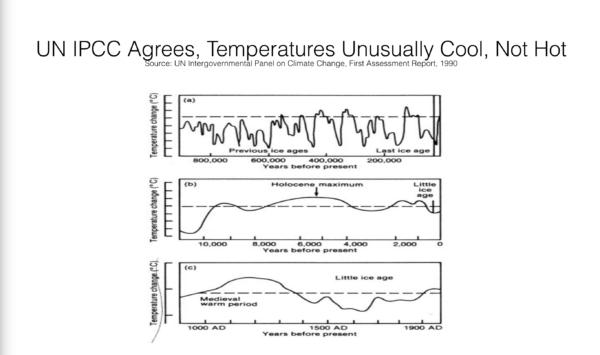
“But it leaves us much cooler than has been the case for the vast majority of time that human beings and human civilization has existed,” Taylor said. “The Earth does not have a fever, even during the El Niño years; the earth has a cold.”
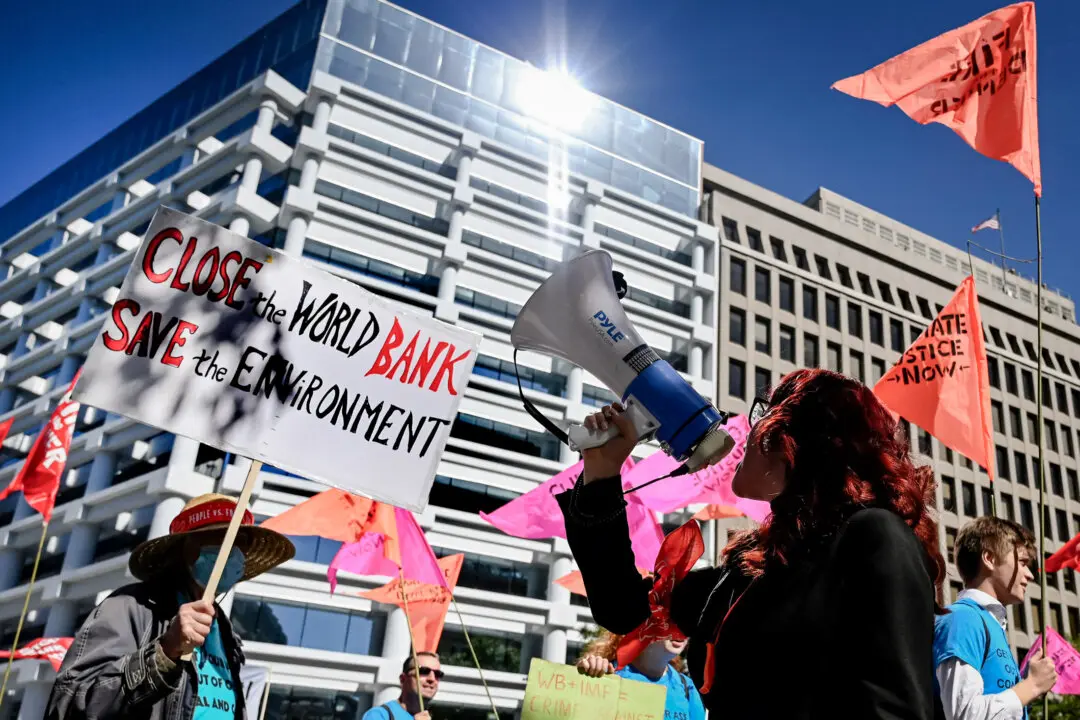
While there are data both in support of and against the theory of CO2-driven global warming, this narrative has been declared “settled science,” and much of current government policy, including new EPA emissions rules, supports it. In addition, hundreds of the world’s largest corporations have signed pledges with global climate clubs such as Climate Action 100+ and the Glasgow Financial Alliance for Net Zero (GFANZ) to reduce the use of fossil fuels.
But according to Watts, “there is a public consensus, and then there is a private consensus.”
He hosts a website on global warming and climate change called WattsUpWithThat.com, and “hundreds of experts comment on that website on a daily basis,” he said. “So it’s been a collective learning experience.”
The private consensus, Watts said, is: “Yes, there’s climate change, but it’s not a crisis.”
“But a lot of people simply don’t want to come out and say this because they’re excoriated for doing so; they get labeled by people that are activists as being climate deniers or shills of big oil,” he said.
According to Watts, climate science has “become a crusade” for those who support the CO2-climate-change narrative. “Some of them truly believe that they’re going to save the planet.”
“There’s a term for it called ‘noble cause corruption,’” he said. “It actually came from the police, where they would plant evidence because they ‘know’ the perp was guilty, so they plant evidence on him to get a conviction.
“The same kind of thing happens in climate science. We see people actively pushing cherry-picked charts and ignoring others because they know that’s going to get continued funding and continued attention.”
Milloy also disputes the notion that the global warming narrative is “settled.”
“There’s no such thing as a consensus in science,” he said. “Science is not done by consensus.”
“El Niño has been going on for millennia, before we even noticed it,” Watts said. “So don’t freak out. It’s weather, and yes, it’ll get cooler after it’s over.”