California’s Orange County voted for Republicans in the governor’s administration and senate this year—according to unofficial election results—a stark contrast with four years ago.
In the last statewide General Election in 2018, the county’s voters opted for Democrats, save for one Independent insurance commissioner candidate.
This is likely due to the lack of anti-Donald Trump sentiment as well as factors like inflation swaying Independent voters to favor Republican candidates, Mike Moodian, senior lecturer of Leadership Studies at Chapman and research analyst on Orange County public policy, told The Epoch Times
Currently, Orange County has more registered Democrats than Republicans—about 684,000 to 604,000—along with 428,000 No Party Preference voters.
But it wasn’t always this way.
Orange County is an outlier among coastal California counties and has historically been known as a “Republican stronghold,” Moodian said.
In the 1990s, Republicans held a 20-percent advantage over Democrats, according to Moodian.
But the county has slowly become bluer in tandem with an increase in its younger and minority populations, who tend to register as and vote for Democrats, he said.
The county voted exclusively for Democratic candidates in the governor’s cabinet and in one senate seat in the 2018 General Election in large part because the No Party Preference and Democratic voters favored Democratic candidates, according to Moodian.
The county swung back toward Republican candidates in November, albeit by a slimmer margin than previous years, because the Trump presidency has ended, and “inflation, gas prices, [and] the economy” may have made Republican candidates more favorable to the Independent voters, Moodian said.
In 2021, the recall effort of Gov. Gavin Newsom failed in Orange County by a slim margin—51.71 percent to 48.29 percent.
Moodian said this was because Newsom’s top opponent Larry Elder was labeled by many as a “Trump Republican.”
“That also just goes to show you how much Orange County has changed over time,” he said.
Orange County’s Election Results Comparison
Here are Orange County’s unofficial results, with 54.7 percent voter turnout, as of 5 p.m. Nov. 30 per the Orange County Registrar’s Office.Governor
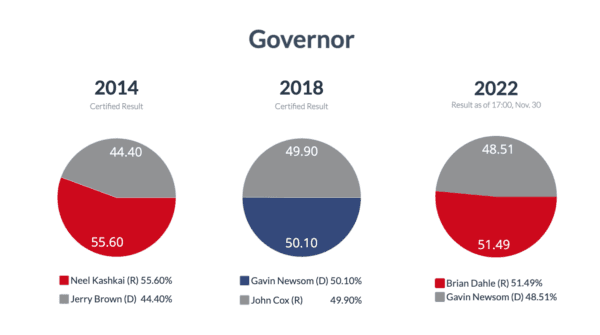
The county’s voters this year chose Republican Brian Dahle to be their governor over Democrat incumbent Gavin Newsom with a vote of 51.49 percent to 48.51 percent, respectively. Newsom won reelection.In 2018, the county preferred Newsom with a slim margin of 50.1 percent over Republican John Cox with 49.9 percent.
In 2014, the election cycle prior to that, the county voted for Republican Neel Kashkari over Democrat Jerry Brown, who won that year.
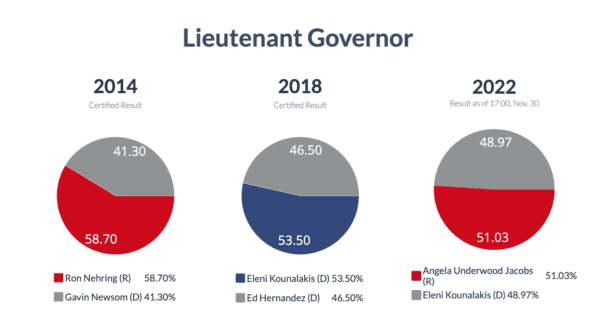
Lieutenant Governor
This year, Orange County voters opted for Republican Angela Underwood Jacobs as their lieutenant governor with 51.03 percent over Democrat incumbent Eleni Kounalakis with 48.97 percent, with the latter winning reelection.In 2018, the county voted in Kounalakis with 53.5 percent of the vote over Democrat opponent Ed Hernandez with 46.5 percent.
In 2014, Ron Nehring, a Republican, won the county’s favor by 58.7 percent over Newsom with 41.3 percent. Newsom won the election.
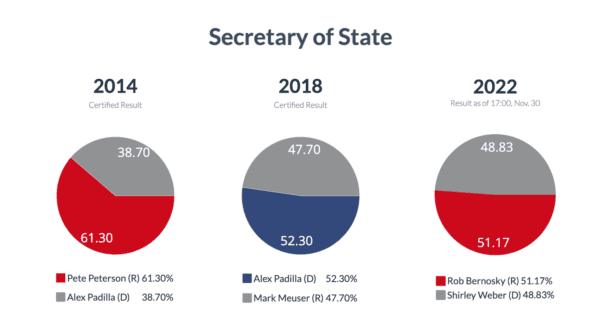
Secretary of State
Orange County preferred Republican Rob Bernosky in the November election with 51.17 percent of the vote over Democrat incumbent Shirley Weber with 48.83 percent. Weber won the statewide race.In 2018, most voters favored Democrat incumbent Alex Padilla with 52.3 percent—who won—over Republican challenger Mark Meuser with 47.7 percent.
In 2014, the county voted for Republican Pete Peterson with 61.3 percent of the vote over Democrat Padilla with 38.7 percent. Padilla was elected.
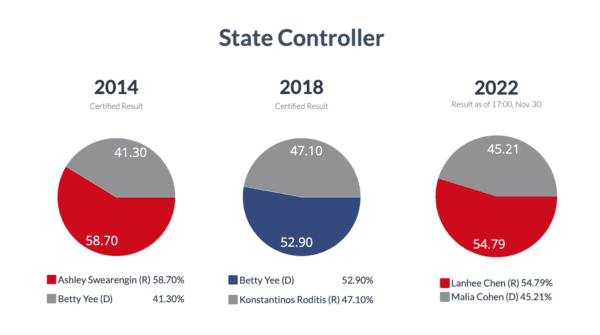
State Controller
Republican Lanhee Chen is winning the county’s vote this year by 54.79 percent against Democrat Malia Cohen with 45.21 percent. Cohen won the election.In 2018, voters opted for Democrat incumbent Betty Yee with 52.9 percent over Republican Konstantinos Roditis with 47.1 percent.
In 2014, the county favored Ashley Swearengin with 58.7 percent over Yee with 41.3 percent. Yee won.
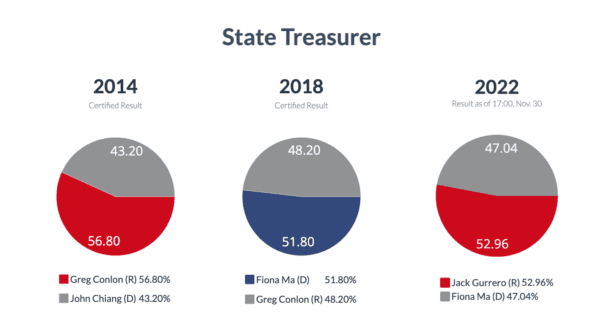
State Treasurer
Orange County voters this November opted for Republican Jack Gurrero with 52.96 percent of the vote over Democrat incumbent Fiona Ma with 47.04 percent. Ma won reelection.In 2018, Ma was preferred by the county over Republican challenger Greg Conlon by 51.8 percent to 48.2 percent, respectively.
In 2014, 56.8 percent of the county’s votes went to Conlon whereas 43.2 percent went to Democrat John Chiang. Chiang won that year.
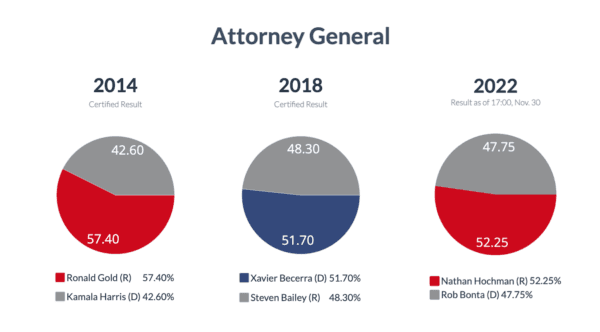
Attorney General
This year, Orange County voted for Republican Nathan Hochman over Democrat incumbent Rob Bonta by 52.25 percent to 47.75 percent, respectively. Bonta won reelection.In 2018, Democrat Xavier Becerra won the vote in the county by 51.7 percent over Republican Steven Bailey with 48.3 percent. Becerra won.
In 2014, Republican Ronald Gold prevailed in the county with 57.4 percent over Democrat incumbent Kamala Harris with 42.6 percent. Harris won the statewide vote.
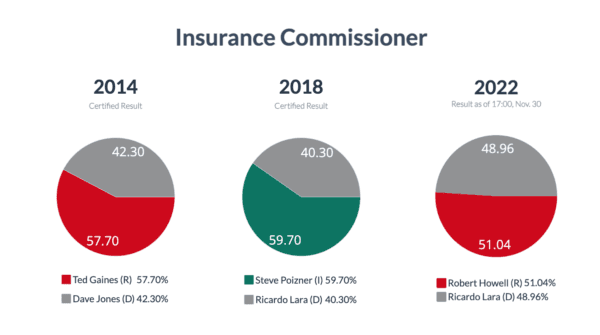
Insurance Commissioner
Orange County voted for Republican Robert Howell in November for the state’s insurance commissioner with 51.04 percent over Democrat incumbent Ricardo Lara with 48.96 percent. Lara won reelection.In 2018, Steve Poizner, who ran as an Independent, garnered 59.7 percent of the vote over Lara with 40.3 percent.
In 2014, Republican Ted Gaines won the favor of the county’s voters with 57.7 percent over Democrat Dave Jones with 42.3 percent. Jones won.
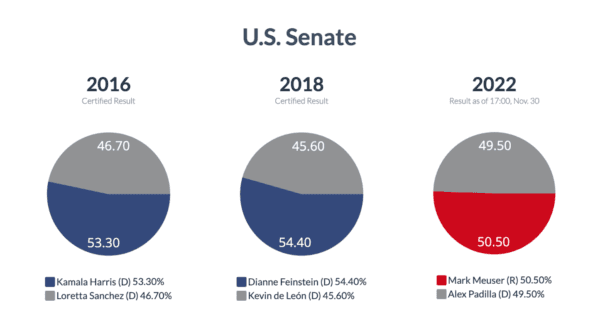
U.S. Senate
Orange County voted for Republican candidate Mark Meuser for a full term with 50.5 percent over Democrat incumbent Alex Padilla with 49.5 percent. The county voted similarly for the same candidates for a partial term. Padilla won both.In 2018, Democrat incumbent Dianne Feinstein faced off against Democrat Kevin de León, winning 54.4 percent to 45.6 percent in the county, respectively. Feinstein won reelection.
The general election prior to that in 2016 saw Orange County vote for Democrat Kamala Harris over Democrat Loretta Sanchez by 53.3 percent to 46.7 percent, respectively. Harris won.