America’s largest cities are increasing their spending at almost unprecedented rates.
A RealClearInvestigations (RCI) analysis of cities with at least 500,000 residents found they cumulatively raised their per-person spending by 18 percent over the past 10 budget cycles, accounting for inflation. The only equivalents on record are the spending surges ignited by the Great Society programs of the 1960s and President Franklin D. Roosevelt’s New Deal during the 1930s.
But unlike cities in those past eras, today’s cities do not have the revenue to support their heavy spending. State and federal funding have dropped off from their record highs during the COVID-19 pandemic, and local tax hikes have not kept pace with spending. Large tax increases or reductions in city services will eventually be required to address burgeoning structural deficits, placing a burden on future generations.
The tradeoff would be easier to explain if cities were making strides to improve life for their residents. Census data, however, show that key quality of life metrics in major cities have mostly been stagnant during the spending spree.
Each of the 38 cities in RCI’s analysis of data from the Census Bureau, FBI, Department of Housing and Urban Development, and enacted local budgets increased spending faster than inflation over the past decade. Yet the cities that boosted their spending the most were, on average, no more or less likely to see measurable progress in reducing homelessness, lowering violent crime rates, tackling income inequality, improving rent affordability, and more. That was the case for the 33 cities led by Democrats and the five cities led by Republicans.


Christopher Thornberg, founder of the policy consulting firm Beacon Economics, isn’t surprised that big spending hasn’t produced big results. He said that cities typically don’t have the financing, policy sophistication, and regulatory oversight to meaningfully improve the economic status of their residents.
But that hasn’t stopped some cities from thinking they “can be successful just fire-hosing money across the economy,” said Thornberg, former director of the University of California–Riverside Center for Economic Forecasting and Development.
The Tax Gap
In 2016, large cities collected $6,727 of revenue per resident from local, state, and federal sources, adjusted for inflation. They spent 14 percent more than that: $7,685 per person.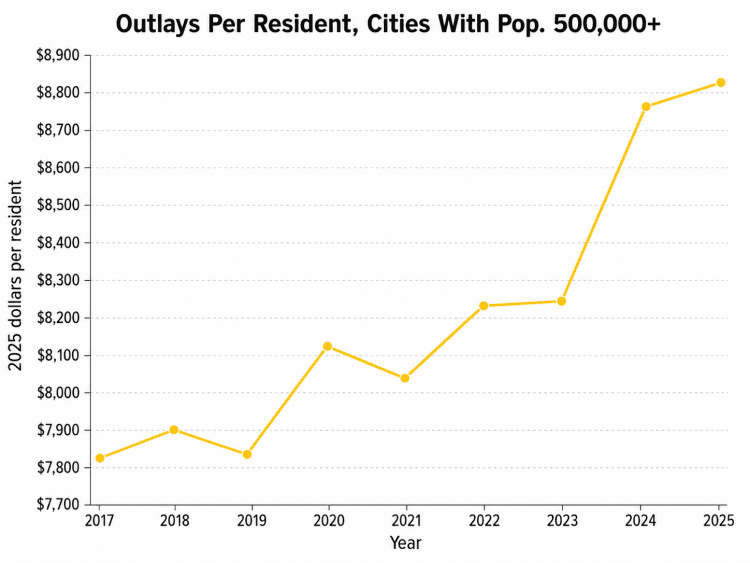
By 2025, revenues had increased to $7,063 per person, but outlays had skyrocketed to $8,827. The difference of 25 percent is the largest gap on record since at least 1940.
The gap was not caused by low revenues. Cities earned record amounts of sales and property taxes last year. Instead, the deficits were driven by expanded bureaucracy, rising payrolls, overtime costs, and pension liabilities.
From 2017 to 2026, the public workforces of large cities grew faster than their populations. There were at least 12 cities that added new municipal jobs even though their populations dropped (a handful of cities do not disclose their staff headcounts). In an extreme example, Memphis added more than 1,000 public jobs even though the city lost more than 40,000 residents.
Many of those new hires work desk jobs. Census data show that large cities increased their administrative expenses—mayor’s offices, human resources departments, accountants, zoning departments, and more—by 55 percent from 2016 to 2023, accounting for inflation.
Crucially, RCI found only a weak statistical link between increases in a city’s property tax collection and increases in its overall spending. Cities such as Phoenix and Boston that boosted their per-resident spending by 88 percent and 75 percent, respectively, were not necessarily the ones with increased property tax revenue to support their outlays.
That suggests many cities have a “build it and we will fund it” mentality, enacting policies before figuring out how to pay for them.
More Spending, More Homelessness
To illustrate these budget dynamics in action, RCI took a look at how some representative cities have responded to major issues.Homelessness in America’s largest cities jumped by 34 percent on average from 2017 to 2024, driven partly by increased housing costs and job losses during the pandemic. RCI’s analysis found no statistically significant association between increased public welfare spending and reduced homelessness.
While Los Angeles is the poster child for getting little bang for the bucks it’s spent to combat homelessness, it is not alone. Seattle and surrounding King County were among the biggest spenders, with money pouring into the Regional Homelessness Authority. It was created by former Mayor Jenny Durkan in 2019 to “significantly decrease the incidence of unsheltered homelessness.” Washington State has also lifted its spending on housing construction sixfold since then. But homelessness in Seattle increased at a faster rate than in any other large city but one, and rent price increases were also among the nation’s highest.
“I don’t care if they’re a sex offender!” Colston said, according to the Seattle Times. “This is an inclusive space, and we are equitable to all.”
Colston was later replaced. Seattle Mayor Katie Wilson has publicly said she’s not opposed to shutting down the authority for its failure to reduce homelessness.
Nor has Portland, another big spender on homelessness, been able to reduce its soaring rate. It created a Supportive Housing Services tax in 2020 that funded Sunstone Way, a nonprofit set up by the city that collapsed in March.
“Cities that have had success in battling homelessness, it turns out, it’s not just that they’re spending money, but how they’re spending money,” Thornberg said.
Although many big cities explicitly state that their budgets are designed to reduce inequality, large cities’ Gini index—a measurement of how evenly wealth is distributed—was virtually unchanged from 2017 to 2024. So was the percentage of the population with health insurance. Poverty rates improved by 1 percent on average. Cities that increased their overall budgets at a faster rate were no more or less likely to see improvement in any of those three categories.
Police Spending Up, Crime Down a Bit
Violent crime rates in large cities improved slightly from 2017 to 2024, with an average decrease of 50 violent crimes per 100,000 people. The average police budget increased slightly faster than inflation.But again, there was no statistically significant association between spending levels and violent crime rates. Cities that increased their police budgets were just as likely to see crime rates rise as cities that decreased theirs.
That’s unsurprising given how much difficulty police departments are having recruiting new officers. Thaddeus Johnson, a senior fellow at the Council on Criminal Justice who has been teaching at Georgia State University since 2014, said college students do not view public service as “glamorous” as they did just a few years ago.
“I used to ask in every class, ‘Who wants to be a cop?’ and a quarter to half of the room would raise their hands,“ Johnson said. ”Since the pandemic, nobody has raised their hand in class, and I’m not exaggerating. There’s no interest among criminal justice majors in policing.”
Johnson said low staff headcounts are not an excuse for rising violent crime.
“If there’s a million officers on the street, crime will still happen,” he said. “It’s really about how you use those officers. What is your supervisor-to-officer ratio? The type of training the officers are receiving? The type of technology that’s available?”
There are several success stories, such as Dallas and San Francisco, which have seen violent crime rates improve after police budgets were increased. Others, such as Boston, saw crime rates improve even though police budgets did not keep pace with inflation.
Kicking the Budget Can Down the Road
Cities will eventually have to balance their budgets, but they may face difficulty raising taxes to do so. Katherine Loughead, a vice president at the nonprofit Tax Foundation, claimed that the recent upward trend in taxation is already causing “widespread unrest” among voters.Almost every major city has a law stating that its outlays and revenues must be equal, but that does not apply to capital spending on infrastructure and city-owned property such as buildings and cars. Many cities also overestimate their revenues and underestimate their spending on paper, allowing deficits to develop.
They close the gap by issuing bonds, digging into reserve funds, selling municipal property, and ignoring obligations to fund public employees’ future pension and healthcare plans.
This summer’s budget hearings in cities across the country will likely represent a new high-water mark in structural imbalances. If past practices prevail, rather than slashing services or raising taxes, most city leaders will find clever ways to once again kick the can down the road.