However, one economist who should know better, Mark Partridge, a professor of economics at Ohio State University, told ABC News, “The climates are better in red states, and Americans like good climates.” If that were true, California has the best climate, so shouldn’t it boast the best economy?
Let’s check it out.
Much as conservatives like me would like to believe the red states are doing the best, that’s not exactly the case. True, people are fleeing some blue (Democrat) states, such as California, New York, and Illinois, for red (Republican) states. But a simple scatterplot on Excel shows there’s only the slightest correlation of GDP growth favoring red states.


In the below graph, the X axis (horizontal) for this and the other charts is Real GDP growth from Q3 2022 to Q3 2023, by state. The Y axis (vertical) here is the percentage of state voters that went for President Trump in 2020. These are the red states—the Republican states. All the data are linked at the end of this article.
(One could use different criteria, such as states with Republican or Democrat governors, or state houses. But the 2020 presidential election is well known and was close. So I’m using that.)
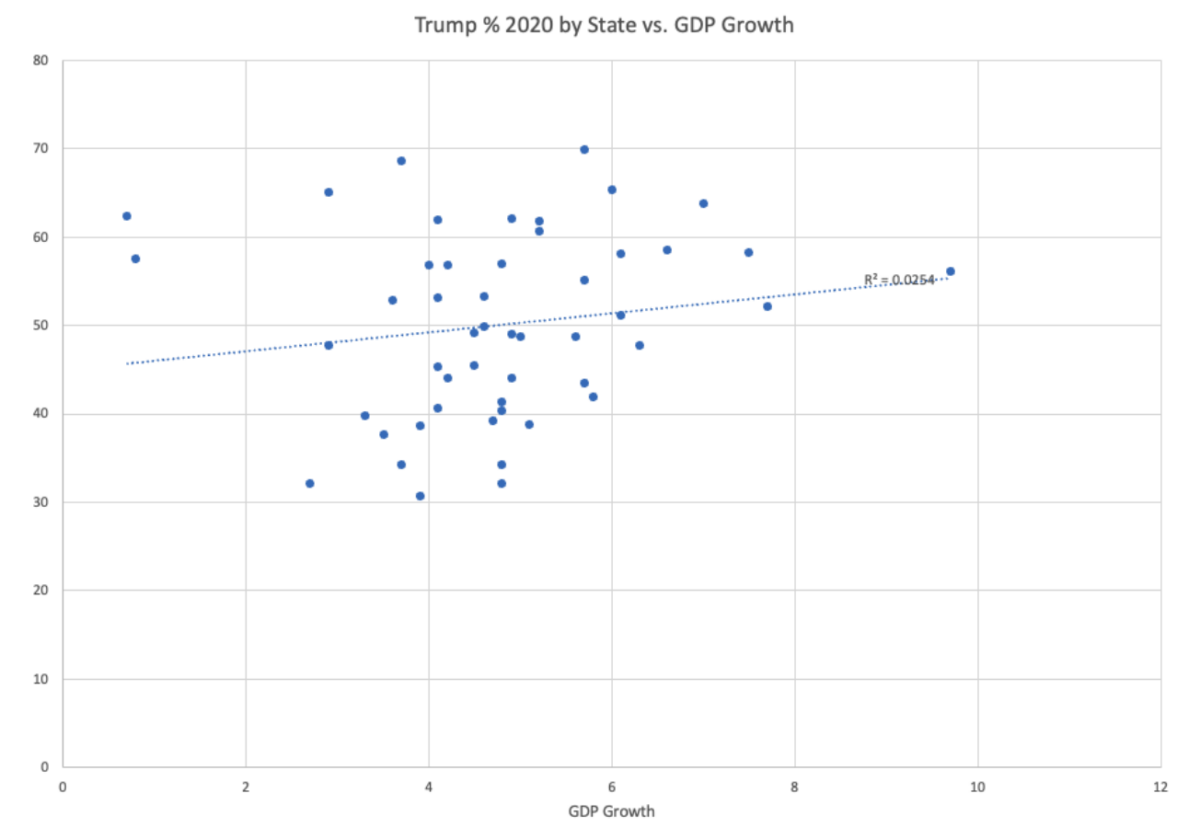
An R2 of 1.0 is total correlation. A “moderate” correlation is 0.3 to 0.5.
Weather Correlation
Now let’s look at the economics professor’s contention that it’s the weather that matters, with economic growth rushing to Florida and Texas.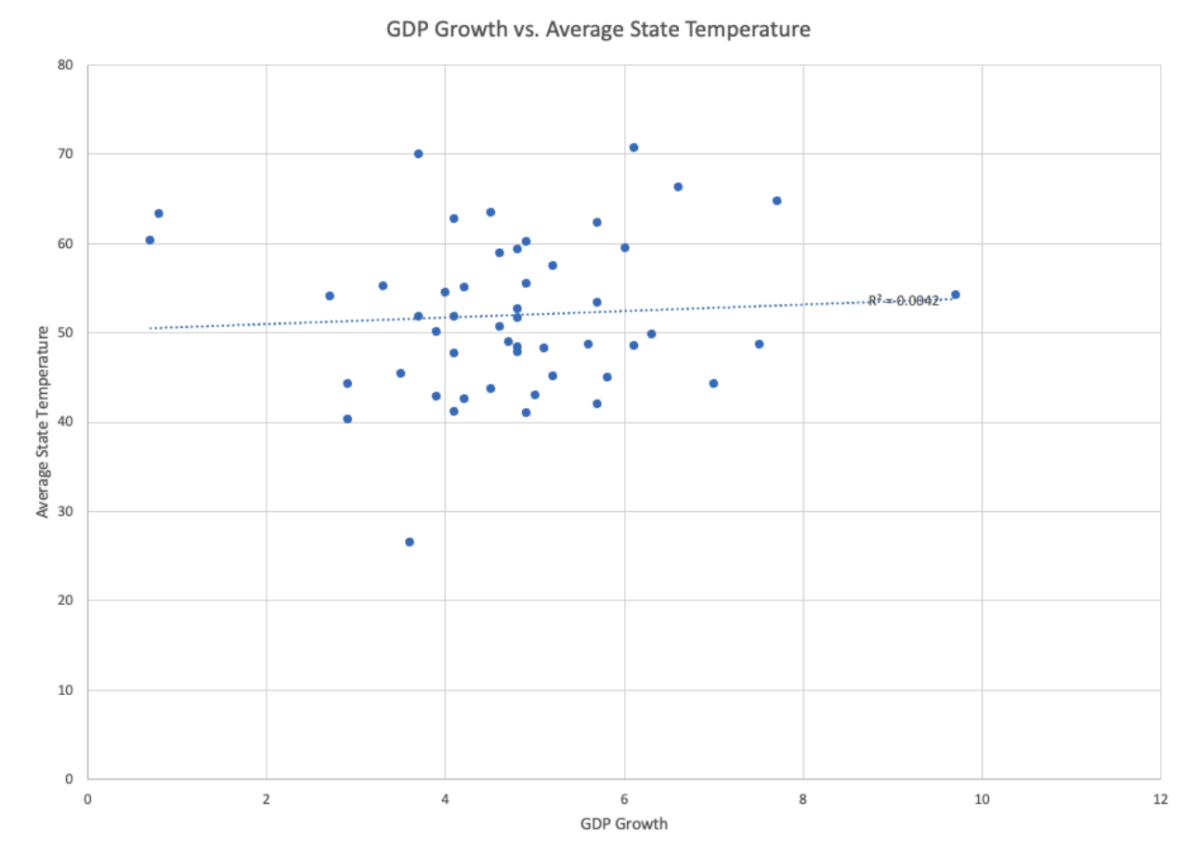
There’s even less of a correlation there. R2=0.0042. The temperature has no effect on economic growth. One reason is, except for perpetually balmy California, warm-weather states have some unpleasant aspects. Houston and Miami are not only warm, but often hot, muggy, and plagued with swarms of insects the size of an F-16.
Income Tax Factor
A bigger factor than whether a state is red, or has warm weather, is the top marginal income tax rate. But it’s also not much of a factor. R2=0.0189 in the downward direction. That means it’s a negligible advantage to have a higher income tax rate, instead of a lower. Statistical dust. So don’t raise taxes because of this chart. California is the one in middle at the top, at 14.4 percent.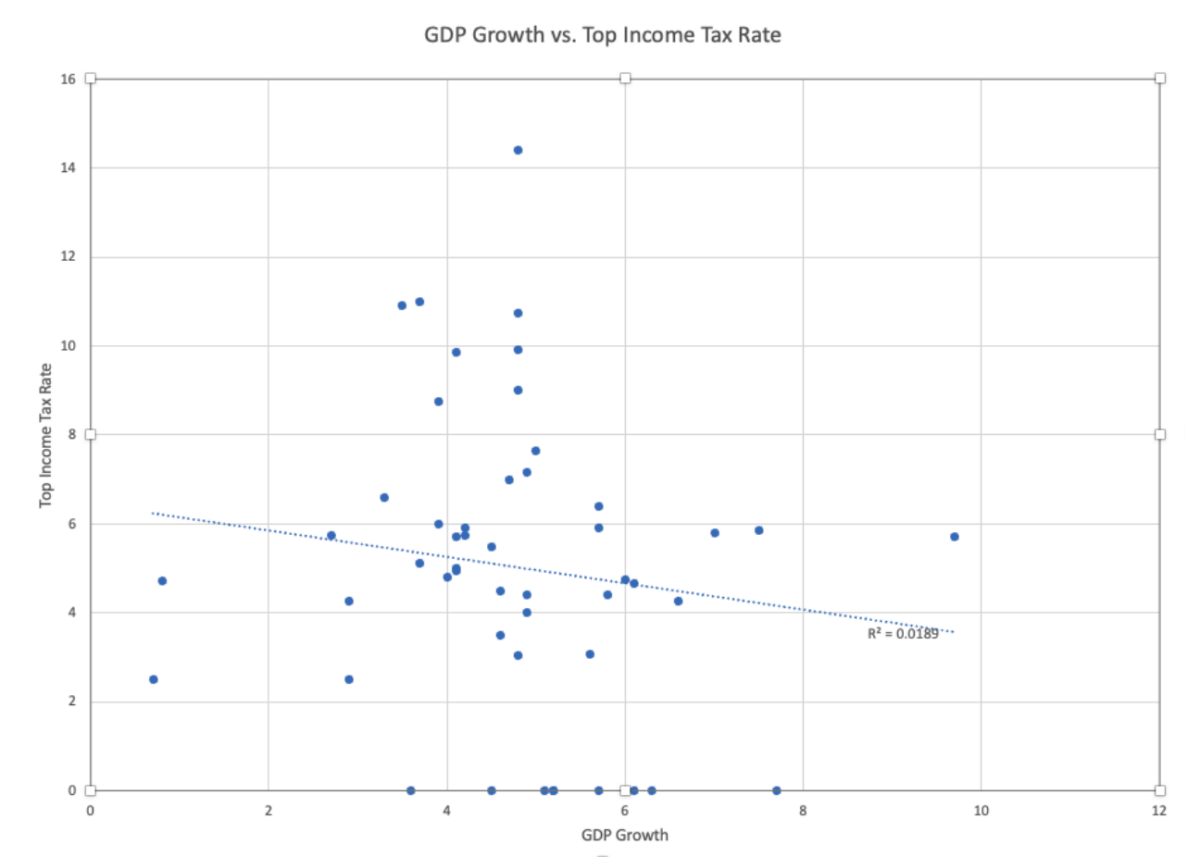
Conclusion: American Economy Is Uniform and Self-Sorts
What can we draw from all this? First, America has a largely uniform economy. The main factors are not state taxes or regulations, but federal taxes and regulations—and the Commerce Clause in the U.S. Constitution, Article I, Section 8, Clause 3: “The Congress shall have power ... To regulate Commerce with foreign Nations, and among the several States, and with the Indian Tribes.” Plus Clause 7, the Postal Clause, “To establish Post Offices and post Roads.”Since 1789, excepting only the Civil War, all Americans have enjoyed one vast, continent-wide free-trade zone, with a uniform system of communication and roads. There are some state peculiarities, such as California’s smog-control regulations on vehicles. But mainly, it’s a huge market now of 340 million people. The genius of the Founding Fathers again is on display.
If you look at the last graph, for the top income tax rate, it shows GDP growth bunched in the middle, between 4 percent and 6 percent. There’s too much similarity among the states for them to be appreciably different.
State Economic Data
Sources:1. For income tax rates, California is corrected to 14.4 percent. 2. New Hampshire and Washington are put at 0 percent, the tax on incomes, but New Hampshire imposes 3 percent tax on interest and dividends and Washington a 7 percent capital gains tax.