The latest unemployment data and non-farm payrolls numbers show that so-called red states are in better shape than blue states.
Data released on Jan. 23 by the Bureau of Labor Statistics (BLS) showed “statistically significant” growth in the unemployment rate in 15 states from the month of November.
“Eighteen states and the District of Columbia had jobless rate increases from a year earlier, 15 states had decreases, and 17 states had little change,” the BLS reported. “The national unemployment rate was unchanged at 3.7 percent, but was 0.2 percentage points higher than in December 2022.”
The states that had the lowest jobless rate in December 2023 were Maryland and North Dakota, each with 1.9 percent. At 5.4 percent, Nevada had the highest unemployment rate.
In all, 16 states saw lower unemployment rates than the 3.7 percent national average. Five states and the District of Columbia had higher unemployment rates than the national average, and 29 states saw unemployment rates that “were not appreciably different from that of the nation.”


For month over month, Massachusetts and Rhode Island saw the highest rise, each at 0.3 percentage points.
Alabama, California, Connecticut, Louisiana, Maine, Montana, New Hampshire, New York, and Washington State saw increases of o.2 percent. Arkansas, Florida, Maryland, and Virginia saw unemployment rise by 0.1 percent.
Minnesota was the only state to see its unemployment rate go down, dropping by 0.2 percentage points.
On a year-over-over basis—from December 2022 to December 2023—19 states saw higher unemployment numbers while 15 states saw their unemployment rates decline.
New Jersey saw the greatest rise in unemployment, 1.5 percent. California was second, with an increase of 1.0 percent, followed by the District of Columbia at 0.9 percent and Alaska at 0.8 percent.
Colorado, Missouri, and Montana each had an increase of 0.6 percent. Idaho, Indiana, and New Mexico had an increase of 0.5 percent. Kentucky and New York saw a 0.4 percent increase in unemployment while Arizona, Florida, Georgia, and Wisconsin saw unemployment rise by 0.3 percent.
Oklahoma, Pennsylvania, and Texas saw unemployment rise by 0.2 percent.
Three states saw a 1.1 percent drop in unemployment over the past year: Maryland, Massachusetts, and Oregon. Wyoming’s unemployment rate fell by 0.9 percent. Hawaii and Vermont had a decrease of 0.8 percent, and Mississippi saw a drop of 0.7 percent.
In states with the largest month-over-month increases in unemployment rates, Democrats held a “state government trifecta” in nine states, meaning they controlled the House, Senate, and the governorship. Republicans held a “state government trifecta” in five states. States that saw unemployment numbers fall were controlled predominantly by Republicans.
‘That’s a Ratio’
When it comes to unemployment numbers, EJ Antoni, Ph.D., says, “It’s important to keep in mind that when we’re talking about the unemployment rate, that’s a ratio.”Mr. Antoni is a Research Fellow in The Heritage Foundation’s Grover M. Hermann Center for the Federal Budget whose research focuses on fiscal and monetary policy.

“You can change the final number, which is a percent, by changing the numerator or the denominator in that fraction,” he explained to The Epoch Times. “For example, if we hold the other parts of the workforce constant and increase the number of unemployed, that will increase the unemployment rate. But you can also increase the unemployment rate if you have people who were previously unemployed who suddenly dropped out of the labor market. In that case, you haven’t actually increased the number of unemployed, but you have increased the unemployment rate.”
It works exactly the opposite in reverse.
Pre-Pandemic Job Rates
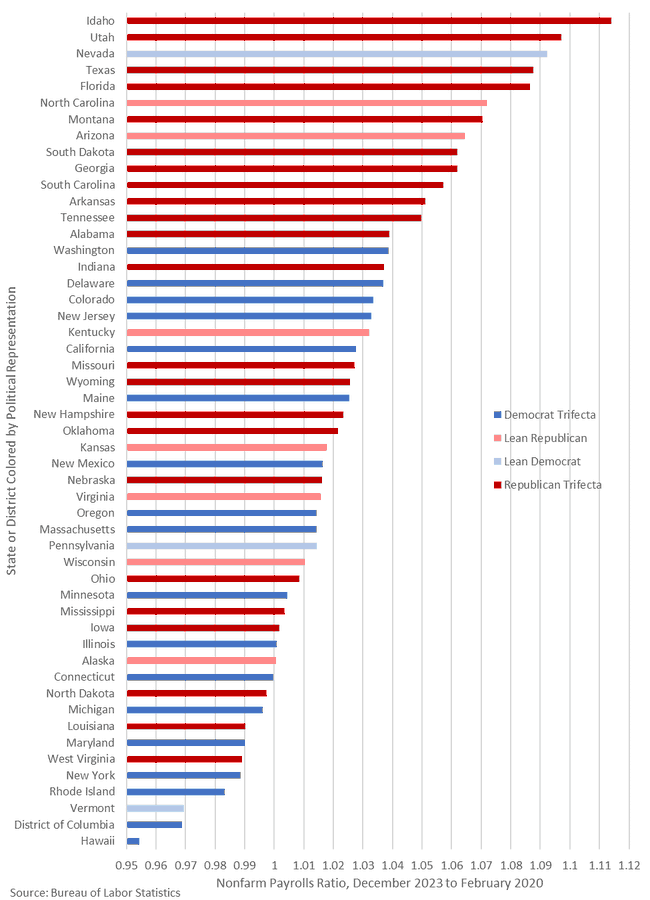
To view the unemployment data from a different perspective, Mr. Antoni cited the graphic he posted to X the same day the BLS released its unemployment data. It’s related to the “Nonfarm payrolls ratio, December 2023 to February 2020.”“Labor market recovery remains highly uneven; here’s how many jobs are in each state relative to their respective pre-pandemic levels and colored by political representation,” he wrote. “Notice anything?”
The chart, he explained during his interview with The Epoch Times, shows the states and the ratios of how many jobs they have today compared to February 2020 and the pre-pandemic job levels.
He noted that the overwhelming majority of the states with the most jobs recovered from pre-pandemic job levels are the states where Republicans hold those “state government trifectas” or states that “Lean Republican.”
Of the top 15 states, 11 have a Republican trifecta.
Idaho placed first, followed by Utah. Additional red trifecta states are Alabama, Arkansas, Florida, Georgia, Montana, South Carolina, South Dakota, Tennessee, and Texas.
One, Washington State, has a Democrat trifecta.
Nevada, a state that “Leans Democrat,” placed second.
North Carolina and Arizona “Lean Republican.”
The outlier, the Democrat-controlled trifecta state of Hawaii, is at the bottom of the list.
“It’s important to realize that the unemployment rate itself never tells the whole story,” Mr. Antoni explicated. “Unemployment can go up for good reasons, and it can go up for bad reasons. If a bunch of people get laid off and the other parts of the labor force stay the same, a higher percentage of your labor force is unemployed so your unemployment rate goes up. But the other thing that can happen is what we’re seeing in Texas and Nevada, where you have far more jobs but a higher unemployment rate. How is that possible? It’s because a bunch of people who previously had given up looking for work suddenly start looking for work.”
But when it comes to the number of jobs held by people in America, red states clearly have the advantage.
“When you look at the number of jobs and actual payroll, not so much the unemployment rate, and you match that to political affiliation, that has a much higher correlation,” he said, “and it’s very clear to see that nearly every state at the top of that list is solid red.”