The California Department of Transportation, affectionately known as Caltrans, divides the state up into 12 districts. District 12, Orange County, is a region to itself, with 34 cities. The Bay Area, District 4, includes nine counties that touch San Francisco Bay and holds 101 cities, more than one-fifth of California’s cities. The counties are Alameda, Contra Costa, Marín, Napa, San Francisco, San Mateo, Santa Clara, Solano, and Sonoma.
Where do these 101 cities stand financially? What is a good measure to obtain their fiscal temperature? And where can one obtain the information?
The easiest thing to do is to go to the city’s website, look for the Finance Department, and click on its Annual Comprehensive Financial Report (ACFR), also referred to as the annual audited financial statements.
Once you have found the ACFR, scroll down to the Basic Financial Statements, then to the Statement of Net Position. Go to the bottom of the page and find the “Unrestricted” amount for Governmental Activities, also referred to as the Unrestricted Net Position (UNP). The ACFR may also provide the population of the city. Divide the population into the UNP to obtain the per capita, which is the amount that applies to each resident. This number will provide a range that is useful for comparison purposes.


The chart below provides the rankings for the cities by the Bay using this simple metric. There usually isn’t much movement year over year in the rankings, but it is helpful to check for any significant changes. Let’s discuss some of the cities that moved eight or more places to see what secrets they may hold, if any.
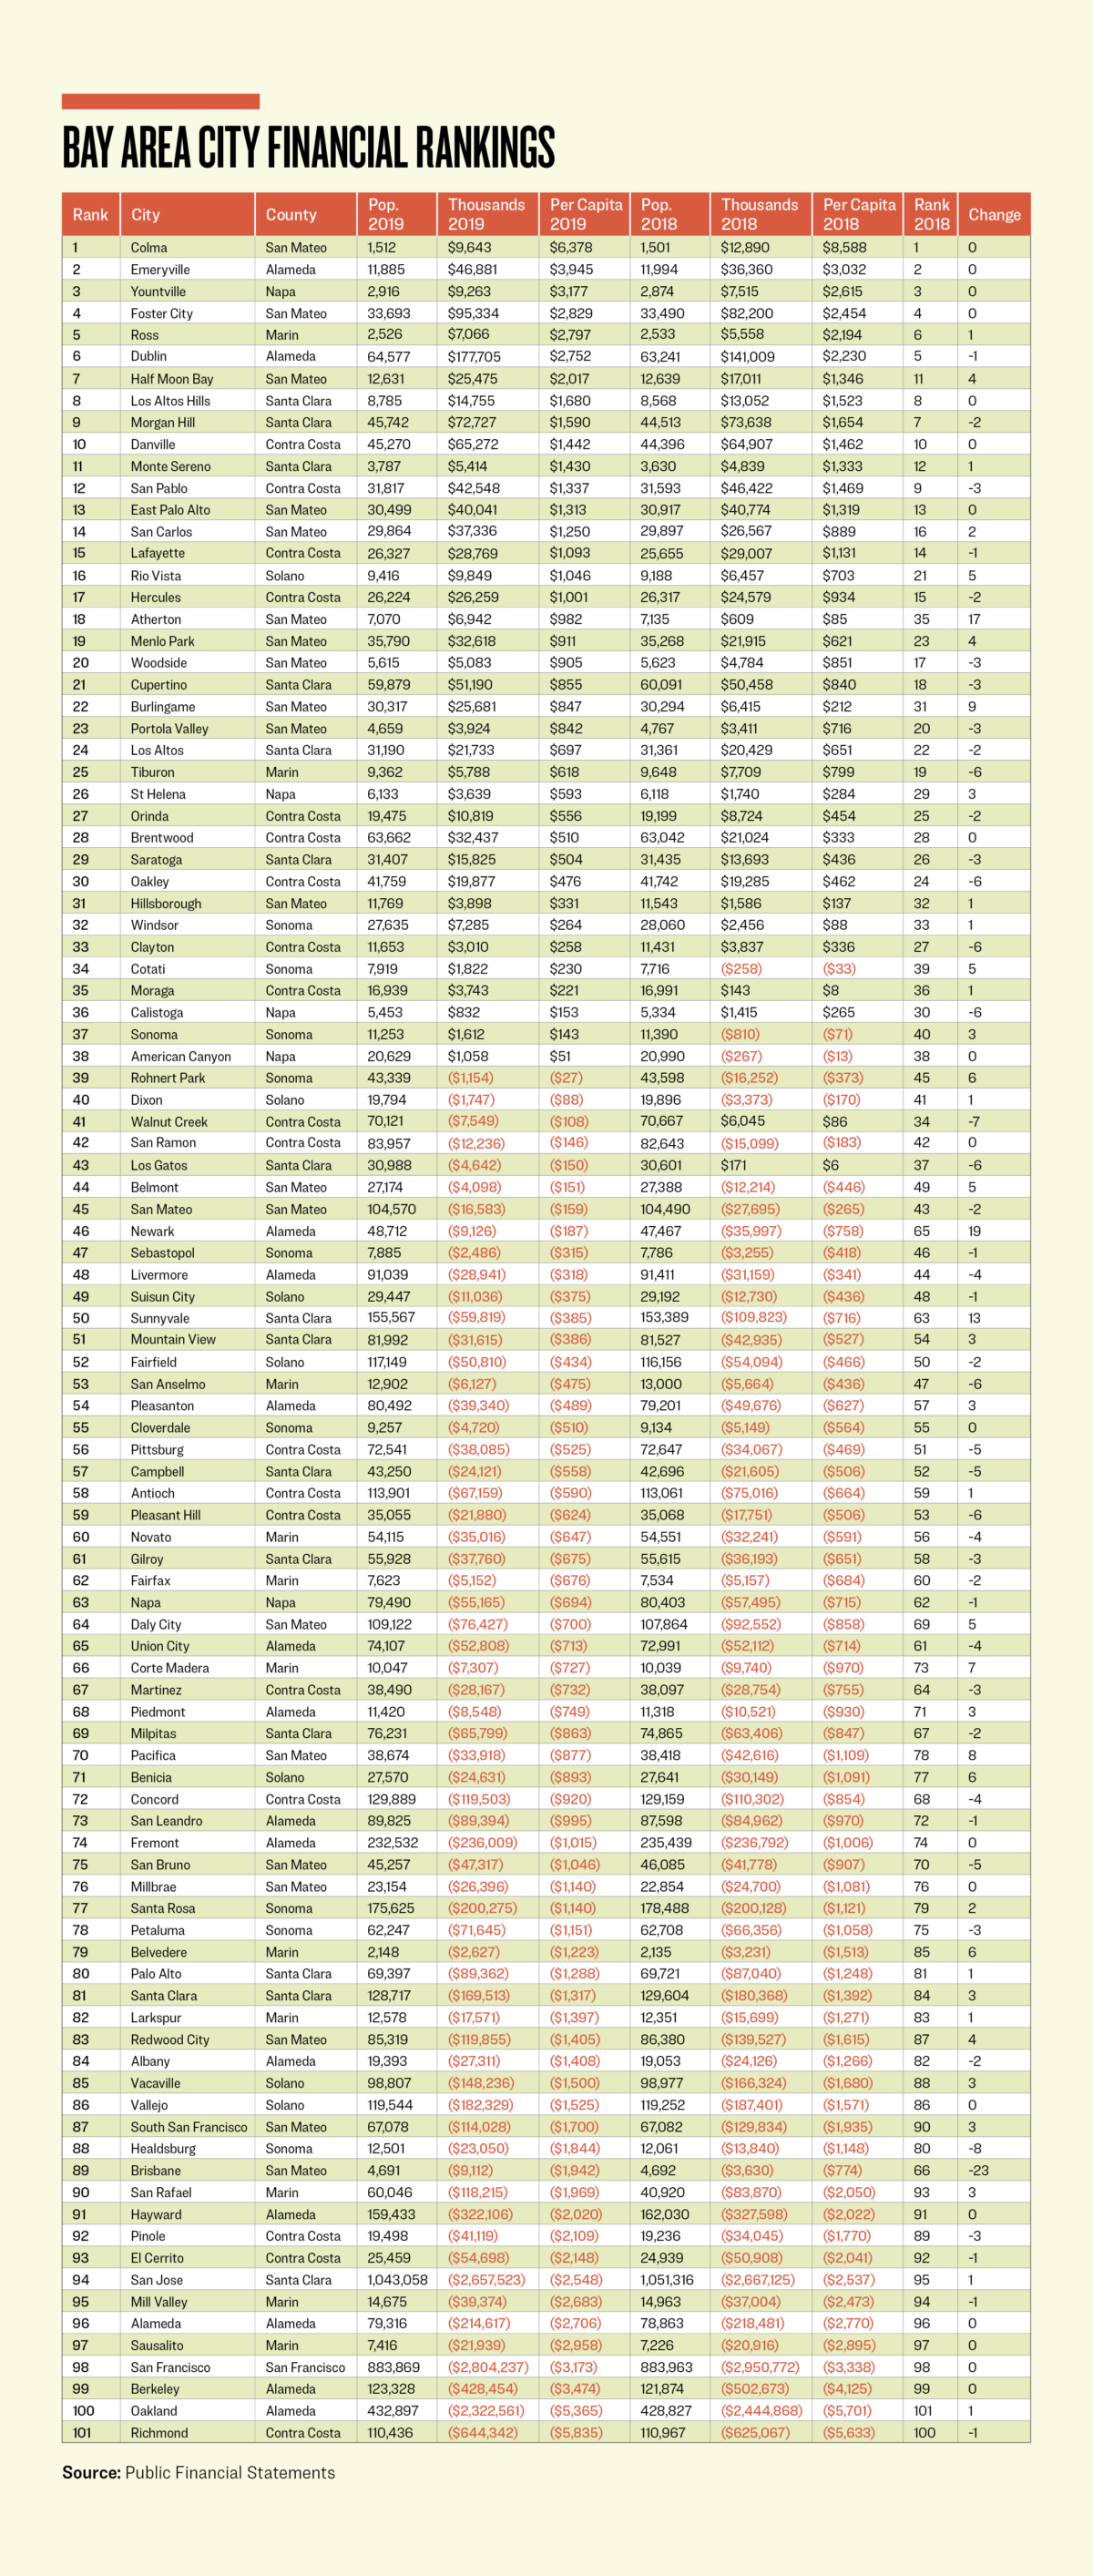
Brisbane almost tripled its UND with a simple accounting adjustment to its Net Investments in Capital Assets of only $5.48 million, but enough for this small city to drop 23 places. Healdsburg dropped eight places in a combination of events, half of it like Brisbane, for an increase in its UND of $9.2 million.
San Jose has garnered significant media attention in the last two decades for its unfunded actuarial accrued liabilities for its defined benefit pension and other post-employment benefits. The heart of Silicon Valley is in 94th place.
The year ending June 30, 2019, is also an interesting starting point, as the next fiscal year will find every city impacted by the beginning of Gov. Gavin Newsom’s drastic COVID-19 pandemic lockdown and the Federal government’s disbursement of significant financial assistance to states, counties, cities, and other municipalities.
In closing, if your city is one of the 38 in positive territory, thank your city council members, past and present, for being fiscally astute in their elected roles. If your city is in the bottom 63, then challenge your city council members to step up their game and start moving the city’s ranking up in the standings. Hopefully their answer is not to raise your taxes, but if it is, then you’ll know why. You may want to enlarge your emergency fund reserves, as you’ll be the one paying the price for poor fiscal decisions by your city and its elected officials.