Commentary
February jobs printed at 275,000 new non-farm jobs this morning, according to the Bureau of Labor Statistics (BLS) Establishment Survey. December and January jobs creation revisions were down by 167,000 jobs. The headline number far surpassed the consensus estimate of 198,000 new jobs, but disappointed on a net basis of 108,000.
But the BLS’s Household Survey, which calculates the number of people taking jobs, and is viewed as eliminating workers taking more than one job, showed 184,000 fewer people working in February than in January. That included 188,000 people who lost jobs or completed temporary jobs.
Let’s look at our exclusive schedule of February Jobs by Average Weekly Wages.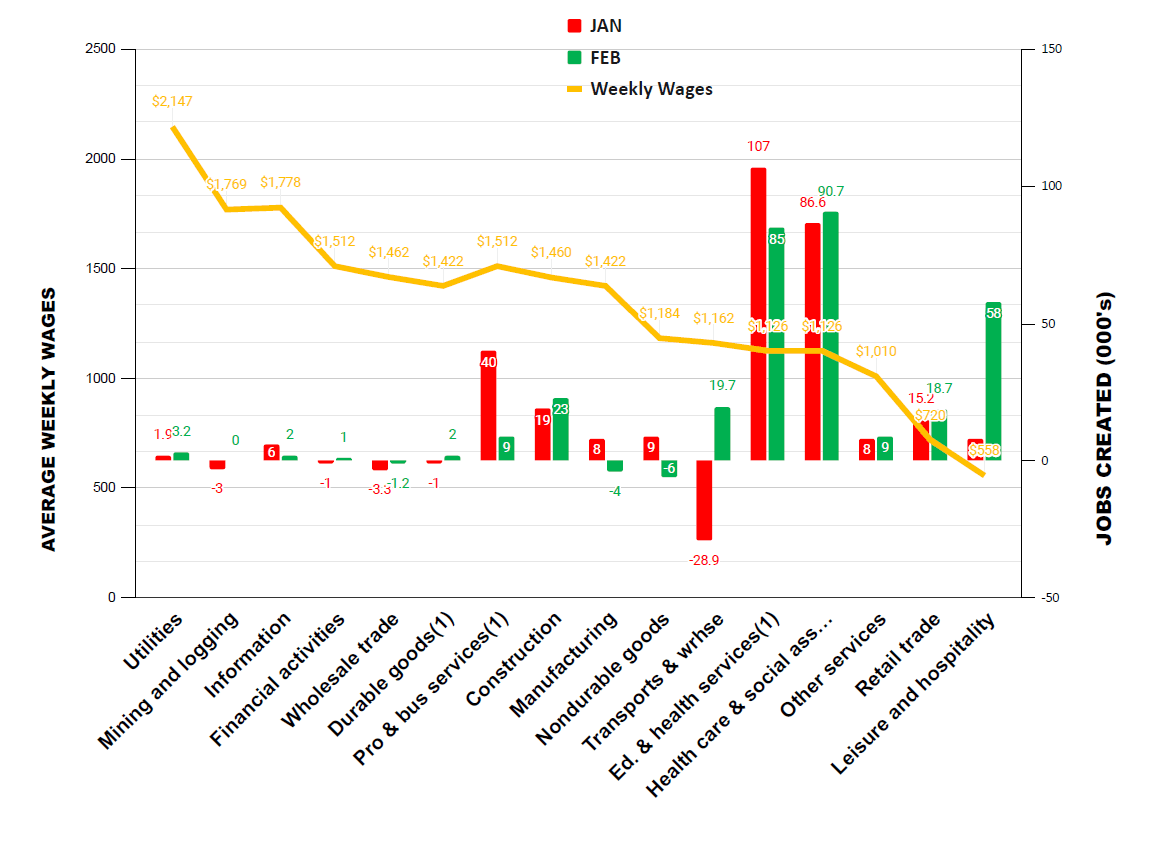
Source: "February Jobs Creation by Average Weekly Wages" / The Stuyvesant Square Consultancy
Jobs creation in higher-paying occupations was virtually moribund, save for business services and construction. Both durable and non-durable goods manufacturing jobs declined. Lower wage jobs, such as in leisure and hospitality, retail, and other services, and jobs that tend to have government support, like education and health services and health care and social services, generated the majority of the new jobs creation in the Establishment Survey.
Data Integrity
Once again, we’ve seen the kind of massive downward jobs revisions we saw in the Establishment Survey that we saw in several months of last year. Coupled with the stunning disparity of 184,000 fewer people working in the Household Survey (versus 275,000 new jobs), one has to wonder, exactly, what is going on at the Bureau of Labor Statistics. We have produced these reports for several years now—over a decade—and revisions of this scale are unusual.One expects some “noise” in the January report, but the data the last year or so seem to be chronically overstated. When media like CNN, whose bias favoring the current administration is self-evident, reports headlines saying, “Another shockingly good jobs report shows America’s economy is booming,” the network reported with January’s “353,000 new jobs” that was first reported (and is now revised down to 229,000, and which will be revised again in the March report)—forgive me for being circumspect about the integrity of the initial jobs data. For investors hoping the Federal Reserve will initiate a rate cut, it’s rather like a hopeful gambler at the $2 window at Churchill Downs betting the long-shot with 100:1 odds, only to have the odds go to even money by the time the race is run.
Economy Generally
Much of the purportedly “great” economy that President Joe Biden touted last night in his State of the Union address is attributable to government spending and looser than prudent monetary policy putting too much money into the economy. It is reflected in the lingering inflation numbers. We have said for quite some time that the Fed’s balance sheet is too large—much larger than it should be, given how far we are from the pandemic, as illustrated here: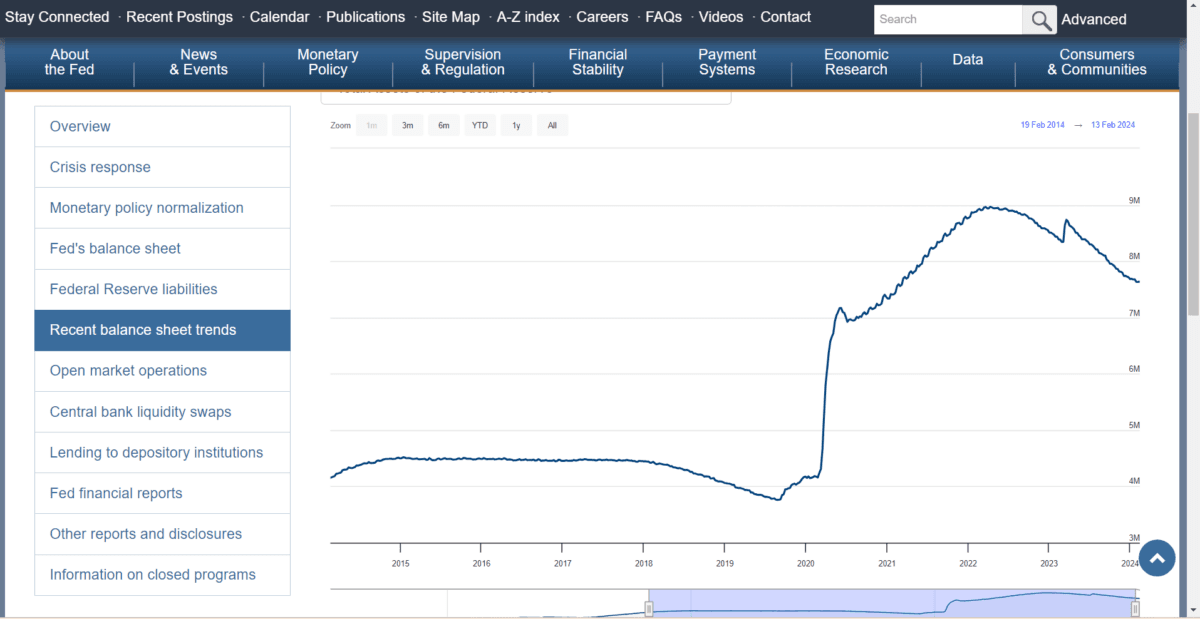
Source: Federal Reserve / "Total Assets of the Federal Reserve, Recent Trends"
So, too, is the money supply, M2, again continuing to be inflated since the pandemic, as illustrated here:
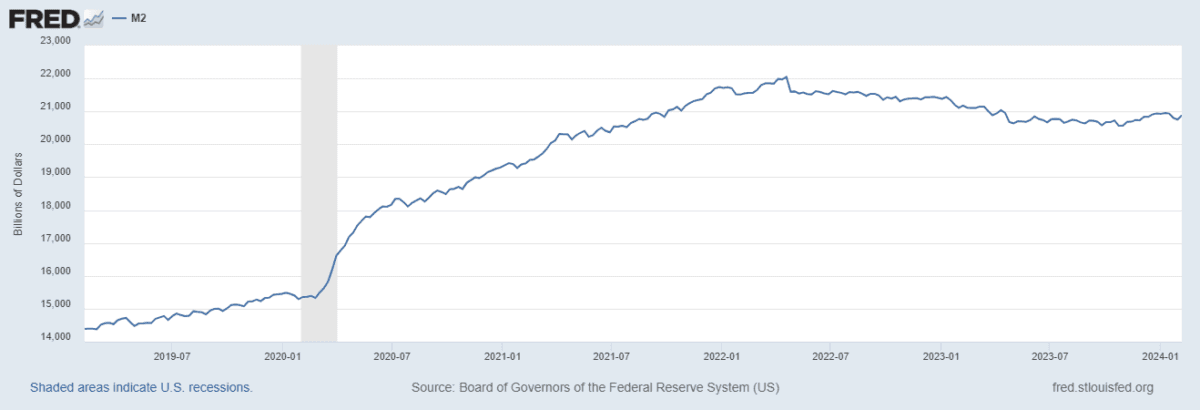
Source: Federal Reserve
We believe that monetary policy, and the Fed’s effort to assure a “soft landing” has been a longer-term mistake. We think the effort to avoid either a lengthy mild recession or—better, a sharp, short recession—continues to be far too accommodating. We think it is merely delaying a reckoning which, because it was delayed, will be much worse than routine acceptance of the business cycle.
Moreover, President Biden’s fiscal policy puts the lie to his claims that he is “building the economy from the middle out” versus the “top down.” His spending—and particularly the deficit spending—that he has continued long after the pandemic—says the opposite, particularly as real wages stay relatively flat.

My readers should look at the schedules of household debt and credit, prepared quarterly by the Federal Reserve Bank of New York, for some troubling debt and credit delinquency figures, particularly among “Generation Z,” young people age 18–29. These young people are the principal drivers of family formation that drives so much of GDP. If they are unable to afford marriage, home ownership, and children because they’re burdened by debt, it will have a serious negative impact on future GDP growth and the U.S. economy.
As CNBC confirms, the administration’s fiscal policy is adding an additional trillion dollars to the national debt every 100 days. All that cash sloshing around—from fiscal and monetary policy—has, we think, artificially boosted asset prices, including home prices, above where they would otherwise be. We believe it sets up a reckoning in the future: either continued inflation (as the spending continues and deficits increase) or a sharp and perhaps lengthy recession—the kind of lengthy economic malaise we saw after the financial crisis of 2008–09. It lasted for a decade.
Failing to arrest this overly dovish fiscal and monetary policy—and soon—will, we believe, result in a Hobson’s choice of policy making, where future prosperity is at substantial risk. But given the promises of higher taxes, more spending, and increased regulation that the president made last night, we are not optimistic.
February’s Other Data Points
We present these other key data points for readers who wish a deeper understanding of our positions.The Institute for Supply Management’s Manufacturer’s Purchasing Managers Index (PMI) for February showed the industrial economy is contracting more rapidly than last month, and contracting somewhat more slowly by 1.3 percentage points, to 47.8. (A reading below 50 signals contraction.) It is the sixteenth consecutive month of contraction.
On the other hand, the ISM Services Index for February, the latest available, showed the service economy expanding, but more slowly, at 52.6 versus 53.4 in January.
The Job Openings and Labor Turnover Survey (JOLTS) for January, released on March 6, improved, with 79,000 more jobs openings in January than in December. Total separations decreased by 40,000.
Privately owned housing units authorized by building permits in January were at a seasonally adjusted annual rate of 1,470,000. This is 1.5 percent below the revised December rate of 1,493,000, but is 8.6 percent above the January 2023 rate of 1,354,000.
For January, personal income and outlays, released Feb. 29, showed disposable personal income up 0.3 percent in current dollars and zero percent in chained 2017 dollars. (“Chained dollars” is a measure of inflation that takes into account changes in consumer behavior in response to changes in prices.) Personal income in current dollars was also up 1.0 percent.
The December Personal Consumption Expenditures (PCE) Index from a year ago, excluding food and energy, released the same day, and reported to be the Federal Reserve’s preferred measure of inflation, printed at 2.8 percent. PCE inflation, also called “headline inflation,” remained unchanged at 2.4 percent.
The RCP/TIPP Economic Optimism Index (previously the IBD/TIPP Economic Optimism Index) fell fell 1.1 percent in March, to 43.5. Optimism among investors gained 2.8 percent from 49.3 in February, to 50.7 in March, while it dropped by 2.9 percent among non-investors, from 41.3 in February to 40.1 in March.
___________________________________________________
The views expressed, including the outcome of future events, are the opinions of this firm and its management only as of March 8, 2024, and will not be revised for events after this document was submitted to The Epoch Times editors for publication. Statements herein do not represent, and should not be considered to be, investment advice. You should not use this article for that purpose. This article includes forward-looking statements as to future events that may or may not develop as the writer opines. Before making any investment decision you should consult your own investment, business, legal, tax, and financial advisers. We associate with principals of Technometrica, co-publishers of the TIPP Economic Optimism Index, on survey work in some elements of our business.
Views expressed in this article are opinions of the author and do not necessarily reflect the views of The Epoch Times.