The 42 school districts in San Diego County, with the exception of Julian Union High, had a rather calm 12 months for the year ending on June 30, 2023.
Every school district in California is required to prepare financial statements, just like a publicly traded company, and have them audited by an independent certified public accounting firm.
Reviewing these reports and taking the Unrestricted Net Position (UNP) for Governmental Activities on the Statement of Net Position (balance sheet), one obtains the “owner’s equity,” so to speak. But how does it compare to neighboring districts? By dividing this amount by the approximate population served, a metric (per capita) is derived that can be used for analysis and comparison purposes.
One-sixth of the districts found their unrestricted net positions improving and moving them up four or more positions in the ranking of this southern most coastal area of California. However, two dropped five or more positions. Let’s review all nine of them. It may give you information that you can utilize, should you decide to attend a school board meeting or engage one of your elected school trustees.


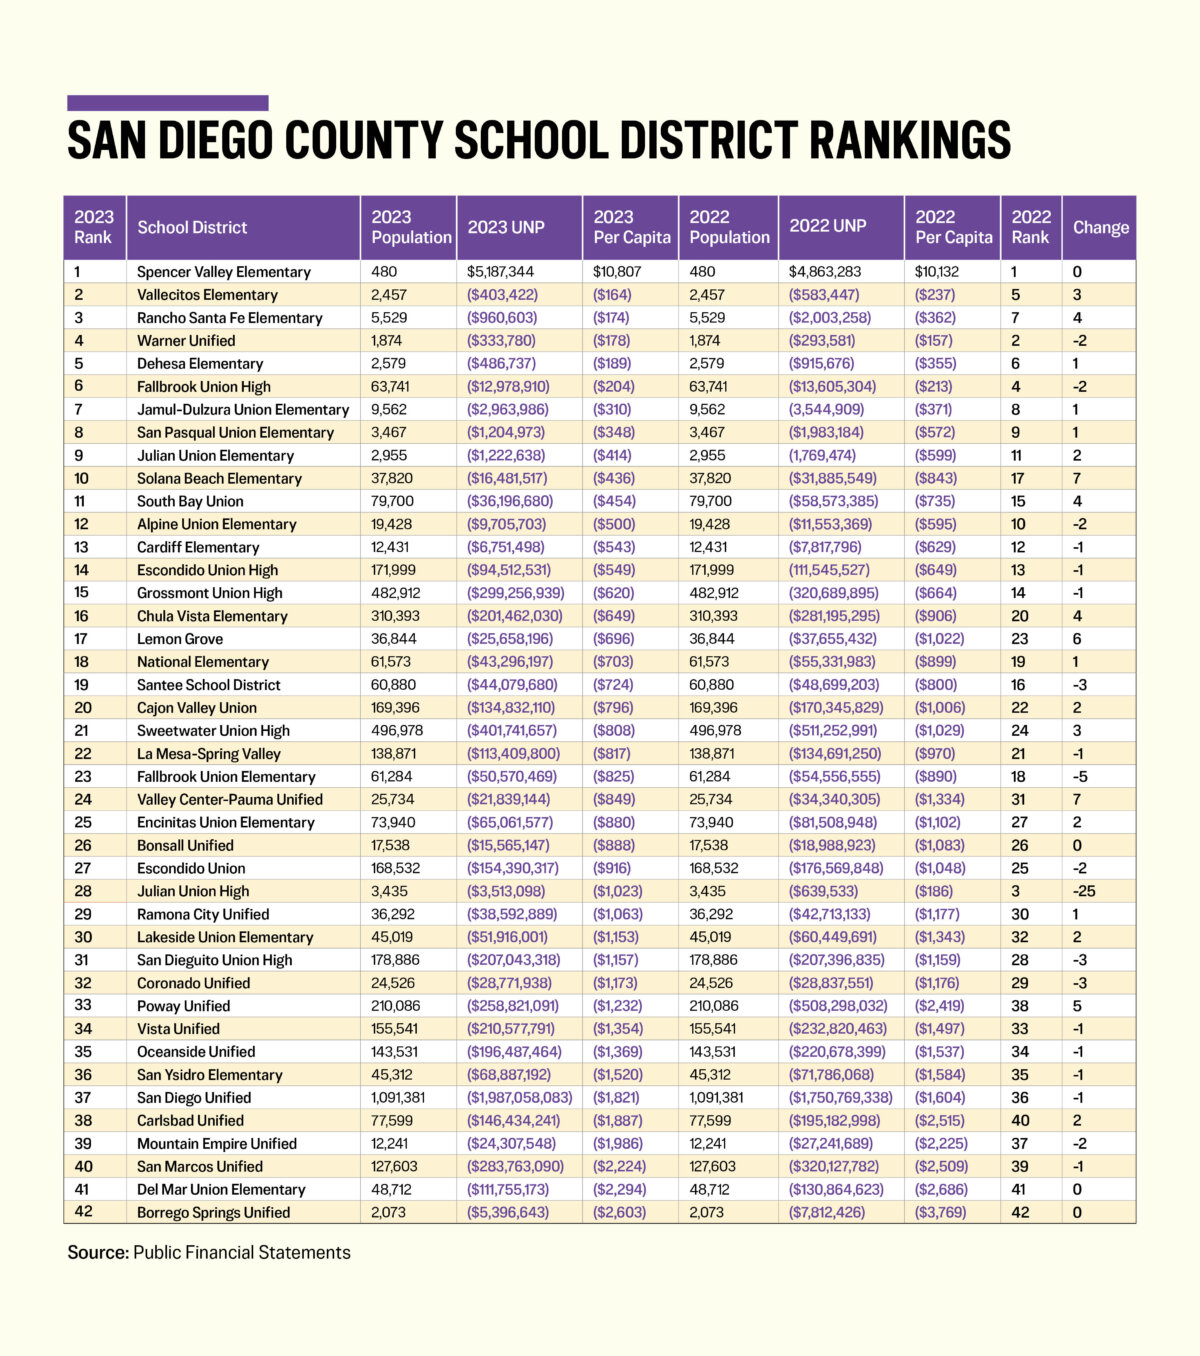
Solana Beach Elementary moved up another seven places. It has been shooting up the rankings like a rocket ship (see 2022). By reviewing the Statement of Activities (page 12) you’ll find that the Change In Net Position (revenues in excess of expenditures) was $22.4 million. The district also withdrew $7.4 million from restricted assets (designated accounts). It also appropriated $14.3 million for fixed assets, accounted for in Net Investment in Capital Assets. This explains the net reduction of $15.4 million to its UNP, cutting the deficit nearly in half.
Residents may also see that long-term liabilities went up by $11.3 million. At first glance, one would think that this would be for loans to finance the capital improvements, but it was not. There was a 25 percent increase in the accrual for Compensated Absences, a growing expense for municipalities in California. And a $16.1 million increase in Net Pension Liability. The details can be found on page 38 of the report. Bottom line: the overall standing is improving dramatically, but with its increasing employee benefit liabilities, this district is not out of the woods yet.
Valley Center-Pauma Unified also moved up seven places. It had revenues in excess of expenditures of $20.7 million and transferred $10.1 million into restricted assets. It saw capital assets decrease $1.9 million, mainly from depreciation. Combined, its unrestricted net deficit was reduced by $12.5 million.
While Lemon Grove had a minor error to its net investment in capital assets account, Poway Unified hit it out of the park. It had revenues in excess of expenditures of $86.8 million and transferred $35 million into restricted assets. It reduced an already negative net investment in capital assets of $18.9 million by $178 million. This is usually seen when mortgage-type debt exceeds the book value of the capital assets used as collateral; sort of akin to negative equity.
A look at Note O of the financial statements shows plenty of movement in the Long-Term Obligation Activity section. General Obligations Bonds saw $28.3 million of new debt and $18.9 million of retirements. Certificates of Participation, a borrowing technique not requiring voter approval, saw new debt of $37 million, with retirements of $54.4 million. Special Tax Bonds show a principal reduction of $19.4 million. The net result was a reduction to capital asset related debt of $28 million. Not an increase.
The big jump was a 50 percent increase in the Net Pension Liability, going from $242.6 million to $367.6 million.
With no increase in capital assets, and a reduction in related debt, it is impossible to explain why the net investment in capital assets account decreased by $178 million. This is why GASB should require a note to the financial statements to provide the details. The net result? The unrestricted net deficit was reduced by $249.5 million, moving it up five places. But, for this retired Certified Public Accountant, it was done under dubious circumstances.
Rancho Santa Fe had revenues in excess of expenditures of $3 million, transferred $0.9 million into restricted assets, and increased its net investment in capital assets by $0.6 million, although net capital assets actually decreased by $1.2 million. The net result should have decreased the unrestricted net deficit by $1.5 million, but the financials show it only reduced it by $1.0 million. This unexplainable anomaly moved the district up four places.
South Bay Union had revenues in excess of expenditures of $34.5 million and transferred $15.8 million into restricted assets. It reduced its net investment in capital assets by $3.7 million. The combination reduced its unrestricted net deficit by $22.4 million and it also moved up four positions.
Chula Vista Elementary had revenues in excess of expenditures of $142.8 million and restricted $46.6 million of it. It increased its net investment in capital assets by $16.5 million, thus reducing its unrestricted net deficit by $79.7 million and also moving up four places.
But a couple of districts had sizable drops in the rankings. Fallbrook Union Elementary had revenues in excess of expenditures of $13 million and transferred $10.4 million into restricted assets. It reduced its net investment in capital assets by $1.4 million. The combination reduced its unrestricted net deficit by $4 million, but it dropped five positions. With so many districts moving up with bigger reductions to their per capitas, those with little changes can be jumped over in the rankings.
This leaves one district that actually had big reasons to drop in the standings. Julian Union High had expenditures in excess of revenues of $306,335 and transferred $33,186 into restricted assets. Long-term liabilities increased by $542,428, due mainly to an increase in employee defined benefit pension unfunded actuarial accrued liabilities, and net capital and lease assets decreased by $300,798 due to depreciation. Therefore, the net investment in capital assets should only have decreased by $300,798. But it increased by $2,534,044, causing the unrestricted net position to increase by $2,873,565! Thus dropping it 25 places. Why?
Both the net capital and lease assets in the assets and the net investment in capital assets in the net position are $5,801,961. They should not be the same number. Someone missed the $2,716,635 in general obligation bonds.
This is one reason why we do rankings and dig into the details. Someone is actually watching on behalf of the taxpayers. And it is why you need to consider doing the same to keep your school district chief business officer accountable and on his or her toes.