This copy is for your personal, non-commercial use only. Distribution and use of this material are governed by our Subscriber Agreement and by copyright law. For non-personal use or to order multiple copies, please contact The Epoch Times Reprints.
New May jobs printed at 339,000 on June 2, according to the Establishment Survey, well above market expectations of 180,000 jobs. Net revisions were were also up 93,000 jobs from March and April. That makes the average three-month jobs creation over 283,000 jobs.
The Households Survey, which is compiled from different data, showed just 175,000 jobs created.
The unemployment rate ticked up to 3.7 percent, up from 3.4 percent in April. The number of unemployed persons increased by 440,000 people from the April figures to 6,097,000.
The U6 number was 6.7 percent, up from 6.6 percent in April. The U6 is a measure of the total unemployed plus all persons marginally attached to the labor force plus total employed part-time for economic reasons, as a percent of the civilian labor force, plus all persons marginally attached to the labor force. The labor participation rate remained 62.6 perecent.
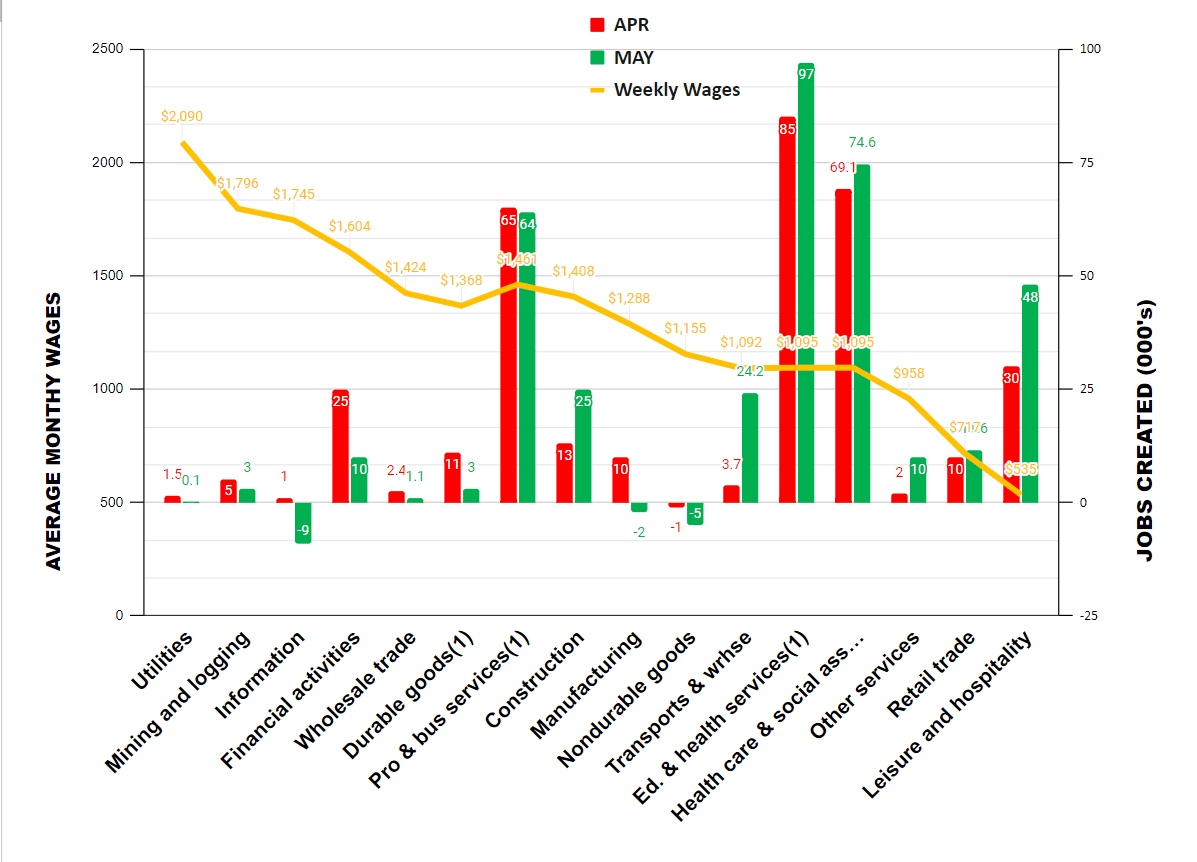
Let’s look at our exclusive chart of jobs creation by average weekly wages:
(Source: The Stuyvesant Square Consultancy / Chart: April/May jobs creation by average weekly wages from May Bureau of Labor Statistics data (c) 2023. (1) Includes other industries, not shown separately.)
Annual real (i.e., adjusted for inflation) wages, which we present quarterly, declined in May in all categories of employment, except mining and logging, construction, and the wholesale trade.
Employment in sectors that tend not to have government support had their biggest gains in professional and business services followed by the lower-wage leisure and hospitality sector.
Educationa and health services, which includes the health care and social assistance sector, and that tend to have considerable government support, printed near 100,000 of the total new jobs reported today. Entitlement programs such as Medicare and Medicaid, as well as federally guaranteed student loans, tend to supplement employment in those industries. Pure government employment, which we do not reflected in our chart, added another 56,000 jobs.
Other Data
The May ISM Manufacturing Index printed at 46.9 on Thursday, down from at 47.1 in April and below expectations.
The ISM Services Index for May has not yet printed.
The Job Opening and Labor Turnover Survey (JOLTS) print for April, which printed on May 31, was up with 358,000 new job openings, so fairly in line with the June 2 print of jobs creation.
Building permits in April, released on May 17, were at a seasonally adjusted annual rate of 1,416,000. This is 1.5 percent below the revised March rate of 1,437,000 and is 21.1 percent below the April 2022 rate of 1,795,000.
Privately owned housing starts in April were at a seasonally adjusted annual rate of 1,401,000. This is 2.2 percent above the revised March estimate of 1,371,000, but is 22.3 percent (±8.7 percent) below the April 2022 rate of 1,803,000.
The other side of the favorable jobs report are disappointing ISM Manufacturing and Services reports that are pointing toward contraction. The Fed’s Beige Book, which summarizes economic activity among each of the Fed’s regional bank territories, was also largely flat, with a couple of districts showing decline and some showing growth.
But as the 4.7 percent core inflation number shows, inflation has continued despite a rapid hike in rates over the last several months. Today’s jobs number likely hardens consumers’ inflation expectations. That’s never a good thing in the inflation fight.
Last month, Fed officials, speaking at various different venues, seemed divided as to whether there might be a pause in the June meeting two weeks from now. It now seems unlikely there will be a pause. We expect a rate hike in the June meeting, tying to what we believe will ultimately be our estimate of a 6 percent terminal rate, but we also hope that the Fed will also accelerate and increase its sale of Fed balance sheet assets to remove excess cash from the economy. That will affect inflation far more, in our view.
We have long held that the issue with U.S. inflation is the Fed’s own massive balance sheet. It was expanded after the financial crisis of 2008–09, and then again during the pandemic. After throttling down somewhat a year ago, the Fed again expanded its balance sheet after the collapse of Silicon Valley Bank. The Fed balance sheet is $8.4 trillion now compared to just around $905 billion prior to the 2008 financial crisis. It has created an asset bubble and a mirage of prosperity. But any hope of returning to a normal economy requires that number to be returned to less than a $1 trillion.
Until we stop so much cash from sloshing around in the Fed balance sheet, inflation will continue and businesses will suffer with higher rates, but with little or no affect on inflation. There will be more bankruptcies as rates continue to increase and squeeze margins, and more pain for would-be homeowners—but little relief from inflation.
We note, too, that the new debt-ceiling deal, with what some anticipate will be at least an additional $4 trillion in debt, will only serve to accelerate inflation and exacerbates the Fed’s inability to reduce its balance sheet.
Outlook
We revise up our predictions. We now estimate second-quarter 2023 GDP will print between 1 percent and 1.5 percent and we withdraw our earlier estimate of a second-quarter start to a recession. That may change if the Fed moves to reduce its balance sheet in the meeting later this month, but we do not expect that to happen.
Our commentaries most often tend to be event-driven. They are mostly written from a public policy, economic, or political/geopolitical perspective. Some are written from a management consulting perspective for companies that we believe to be underperforming and include strategies that we would recommend were the companies our clients. Others discuss new management strategies we believe will fail. This approach lends special value to contrarian investors to uncover potential opportunities in companies that are otherwise in a downturn. (Opinions with respect to such companies here, however, assume the company will not change).
The views expressed, including the outcome of future events, are the opinions of the firm and its management only as of June 2, 2023, and will not be revised for events after this document was submitted to The Epoch Times editors for publication. Statements herein do not represent, and should not be considered to be, investment advice. You should not use this article for that purpose. This article includes forward-looking statements as to future events that may or may not develop as the writer opines. Before making any investment decision you should consult your own investment, business, legal, tax, and financial advisers. We associate with principals of TechnoMetrica, publishers of the TIPP Index on survey work in some elements of our business unrelated to that index.
J.G. Collins is managing director of the Stuyvesant Square Consultancy, a strategic advisory, market survey, and consulting firm in New York. His writings on economics, trade, politics, and public policy have appeared in Forbes, the New York Post, Crain’s New York Business, The Hill, The American Conservative, and other publications.