U.S. home prices continued to climb in March and have risen nearly 15 percent since the beginning of 2020.
That is the takeaway of a U.S. housing market analysis by Standard & Poors, in conjunction with CoreLogic. The study was completed using a method advocated by Nobel-laureate Robert Schiller, which uses actual home price transactions compared to the property’s previous sale price.
Home prices in many western cities are climbing much faster than home prices nationally. In Seattle, prices are up 24 percent since the beginning of 2020; In Phoenix, they were up 22.5 percent during that same period.
Within California, home prices during that 15 month period were up 21.8 percent in San Diego, 15.5 percent in San Francisco and 15.2 percent in Los Angeles.
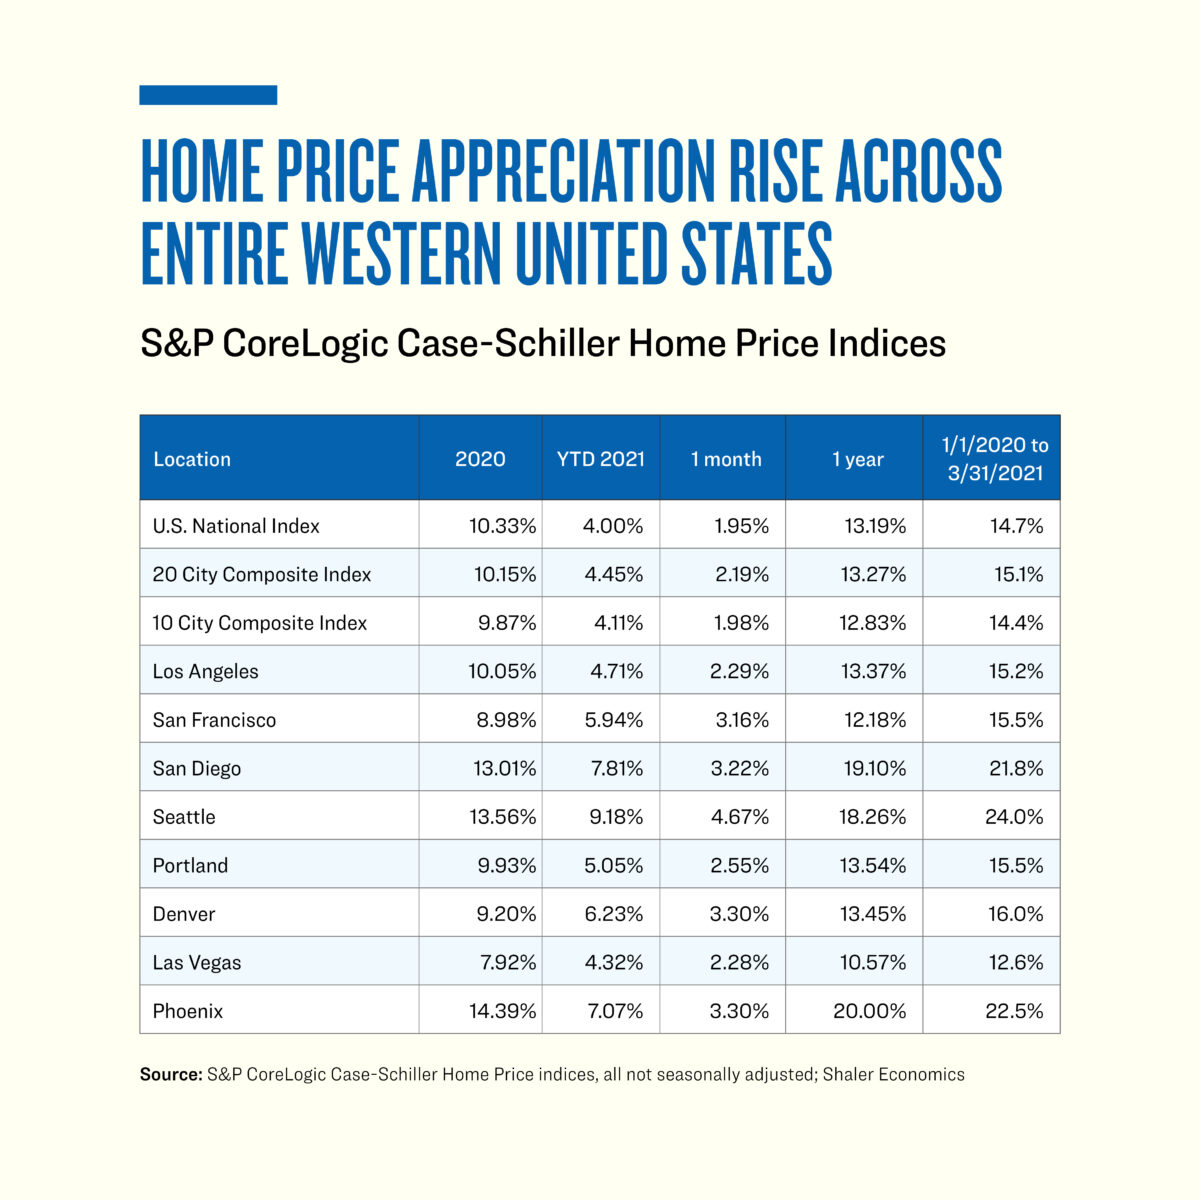
The Epoch Times analysis of the Standard & Poors CoreLogic data analyzed home prices from Jan. 1, 2020 to March 31, 2021 to provide some context excluding the dramatic slowdown in home-buying activity during Spring 2020, when the pandemic caused panic buying of home goods and panic selling of financial products.
From the decrease in urban rental rates and the dramatic increase in suburban housing prices, it is easily determined that many renters from urban centers moved away from higher density areas and purchased homes in less dense, suburban areas.
At the same time, the inventory of existing homes for sale is far below levels in 2018 and 2019.
According to recent data from the National Association of Realtors, in 2018 there were enough homes for sale to supply four months of house-buying activity. In 2019, there was 3.9 months of supply.
However, in April, there was just 2.4 months of supply for the expected level of demand from home-buyers. The total number of homes for sale in April was only 1.16 million nationwide, down substantially from the 1.53 million homes for sale in 2018.
The National Association of Realtors’ (NAR) chief economist Lawrence Yun, said, “First-time buyers in particular are having trouble securing that first home for a multitude of reasons, including not enough affordable properties, competition with cash buyers and properties leaving the market at such a rapid pace.”
The NAR said properties remained on the market on average only 17 days in April, with 88 percent of homes being on the market for less than a month.
First time home-buyers represented 31 percent of sales in April while individuals buying a second home or buying a home as an investment represented 17 percent of sales during the month. Individual investors make up many of the all-cash buyers. All-cash buyers represented 25 percent of all buyers in April, according to the NAR.
Looking forward, Yun expects “more inventory [to] come to the market later this year as further COVID-19 vaccinations are administered and potential home sellers become more comfortable listing and showing their homes. The falling number of homeowners in mortgage forbearance will also bring about more inventory.”
If that happens, home price appreciation might slow down and home-buyers might start to have a little bit more choice in their home-buying decision. Meantime, the tight supply still makes much of the U.S.—and much of the Western U.S. in particular—a strong seller’s market.