US Durable Goods Orders Rebound in December, as Core Capital Goods Orders Dip

US Durable Goods Orders Rebound in December, as Core Capital Goods Orders Dip
Wando Welch Terminal in Mount Pleasant, South Carolina, on May 10, 2018. (Reuters/Randall Hill/File Photo)
Tom Ozimek
1/28/2020
Updated:
1/28/2020

U.S. orders of durable goods—products designed to last at least three years—rebounded by 2.4 percent in December 2019, driven by a boost in military spending, data released by the Commerce Department on Jan. 28 shows.

Demand for military equipment surged in December after Congress passed funding bills that included a boost in defense spending, with the Commerce Department figures showing orders for defense capital goods up 90.2 percent month-over-month.

New orders for transportation equipment rose 7.6 percent, because of a 168 percent jump in orders for defense aircraft.

Taking military planes out of the equation, however, orders for nondefense aircraft fell by 74.7 percent, likely reflecting the grounding of Boeing’s 737 MAX jetliner, following two deadly crashes.

Excluding defense, overall durable goods orders fell in December by 2.5 percent.

Graph shows new orders for durable goods in 2019. (U.S. Census Bureau)

‘Soft Patch but No Downturn’

New orders for nondefense capital goods excluding aircraft—or so-called core capital goods orders, a proxy for business investment—fell by 0.9 percent in December from the previous month. It was the biggest drop since April 2019.

Year-over-year changes to core capital goods orders were positive, however, growing by 0.96 percent to $68.62 billion in December 2019 from $67.96 billion in December 2018.

“That year-over-year rate of increase was slower in December than it was in January,” trade expert and author Alan Tonelson told The Epoch Times. He said the change in core capital goods orders between January 2018 and January 2019 amounted to a growth of 4.07 percent.

“There’s definitely been slower growth in core capital goods spending, at least according to this data,” Tonelson said of the newly released figures, “but it’s very difficult to see where there’s been a major downturn, or frankly any downturn at all. There was definitely a soft patch in the middle of 2019, and you can also see signs in these figures that manufacturing, at least as it’s measured by these durable goods orders, is slowly, but surely, moving out of that soft patch.”

An aerial photo shows shipping containers at the Port of Seattle and the Elliott Bay waterfront in Seattle, Washington, on March 21, 2019. (Reuters/Lindsey Wasson)
As evidence of a possible pick-up in manufacturing activity, Tonelson pointed to data released on Jan. 28 by the Federal Reserve Bank of Richmond, which is a gauge of broad activity in the manufacturing sector located in the Fifth Federal Reserve District in Richmond, Virginia.

“The headline number registered its biggest monthly increase from slightly negative to well into positive territory, since February 2013,” Tonelson said. “It was not only a strong report across the board, but those strong totals included a strong capital spending number.”

The Richmond Fed’s composite index rose to 20 in January from −5 in December, with increases in all three components of the composite measure—shipments, new orders, and employment.

Fifth District Survey of Manufacturing Activity composite index, published on Jan. 28, 2019. (Federal Reserve Bank of Richmond)

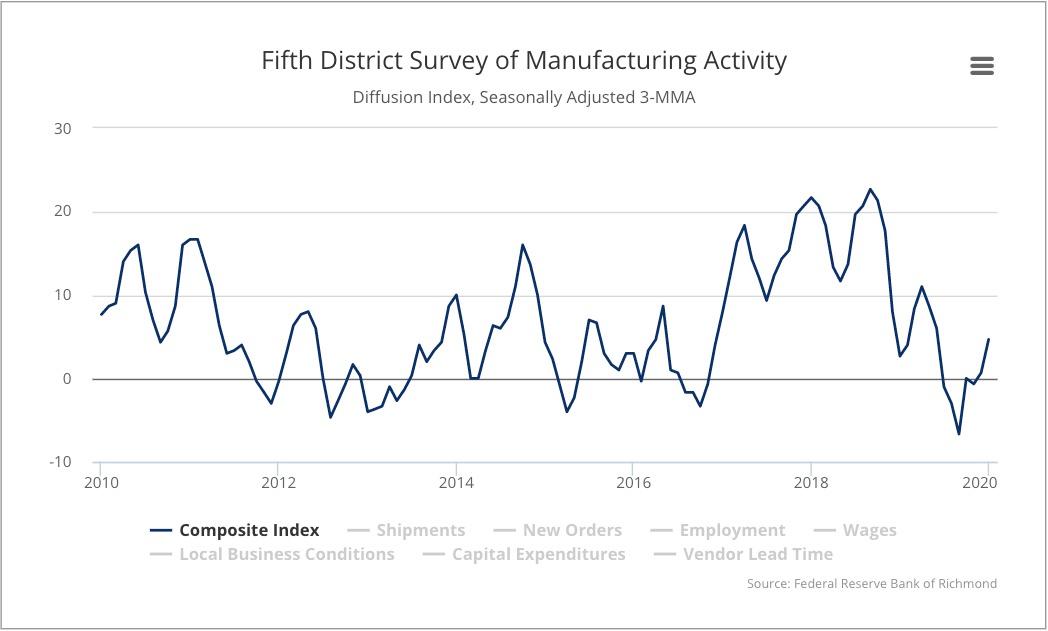
Both new orders and capital expenditures also saw growth.

“Manufacturers were optimistic that conditions would continue to strengthen in the coming months,” the Richmond Fed stated in a release (pdf).
Fifth District Survey of Manufacturing Activity, also known as the Richmond Manufacturing Index, with New Orders and Capital Expenditures highlighted, published on Jan. 28, 2019. (Federal Reserve Bank of Richmond)

While the Richmond data is regional and narrow in scope, it’s more timely than the Commerce Department figures and therefore can serve as a better real-time barometer of manufacturing activity, notwithstanding its regional limitations.

Still, recent data has painted a mixed picture of the U.S. manufacturing industry. The Federal Reserve reported earlier this month that factory output increased 0.2 percent in December from November, but a recent survey of purchasing managers from data firm IHS Markit indicated manufacturing activity has slowed during January compared with December.

“Because of these Boeing problems and now because of the China virus, it’s really questionable how well future hard or soft data is going to measure the underlying health of the U.S. manufacturing industry,” Tonelson said, adding that China is not only still a big market for U.S. manufacturing exports but it is also a major supplier of U.S. manufacturing inputs.

“Clearly some cramps are going to be put on U.S.-China trade both ways, if only because China’s own economic activity looks like it’s set to slow significantly,” Tonelson added.

Tom Ozimek is a senior reporter for The Epoch Times. He has a broad background in journalism, deposit insurance, marketing and communications, and adult education.
twitter
Related Topics