This morning’s jobs numbers stunned the markets, printing at 336,000 new jobs across a wide category of employment, against consensus market expectations of 170,000. Revisions also stunned, adding another net 139,000 more jobs for July and August. The unemployment rate printed at 3.8 percent.
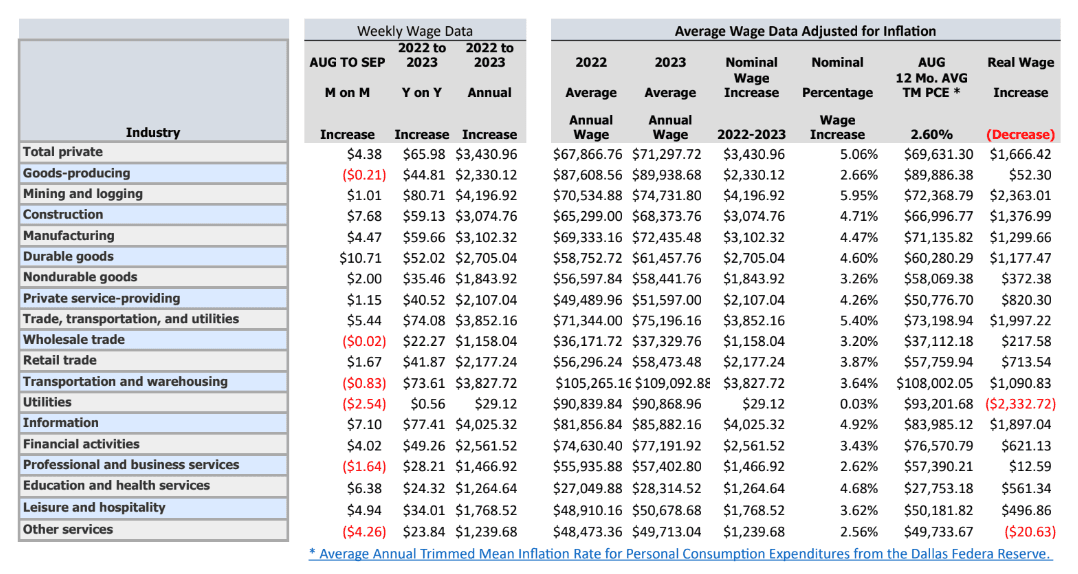
Let’s turn to our exclusive analysis of September Jobs by Average Weekly Wages:
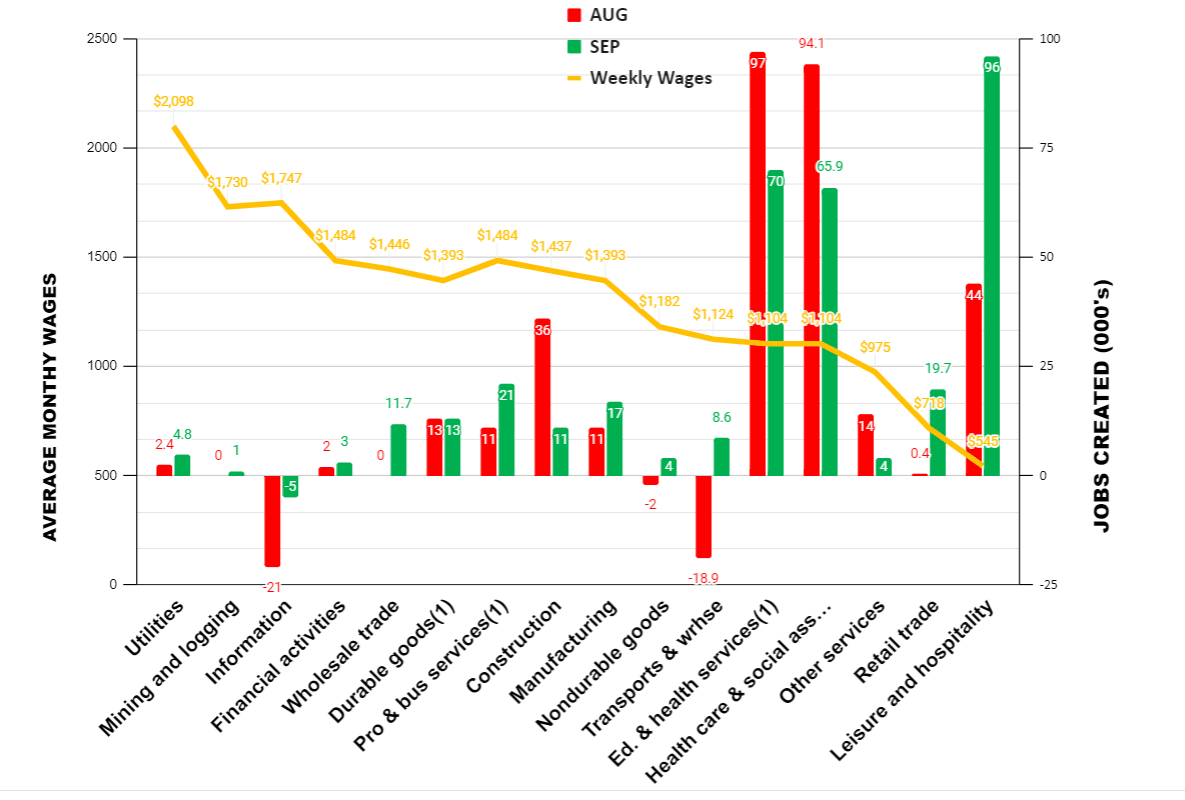
While jobs were created across a wide spectrum of employment categories, the largest gains were in the low-wage leisure and hospitality sector. The second-largest contributor to jobs creation was education and health services (97,000), which tend to have considerable government support. Finally, government hires was third, printing at 73,000 new jobs. (Our charts do not show government employment data because it is not reflective of the health of the overall economy.)
Analysis and Opinion
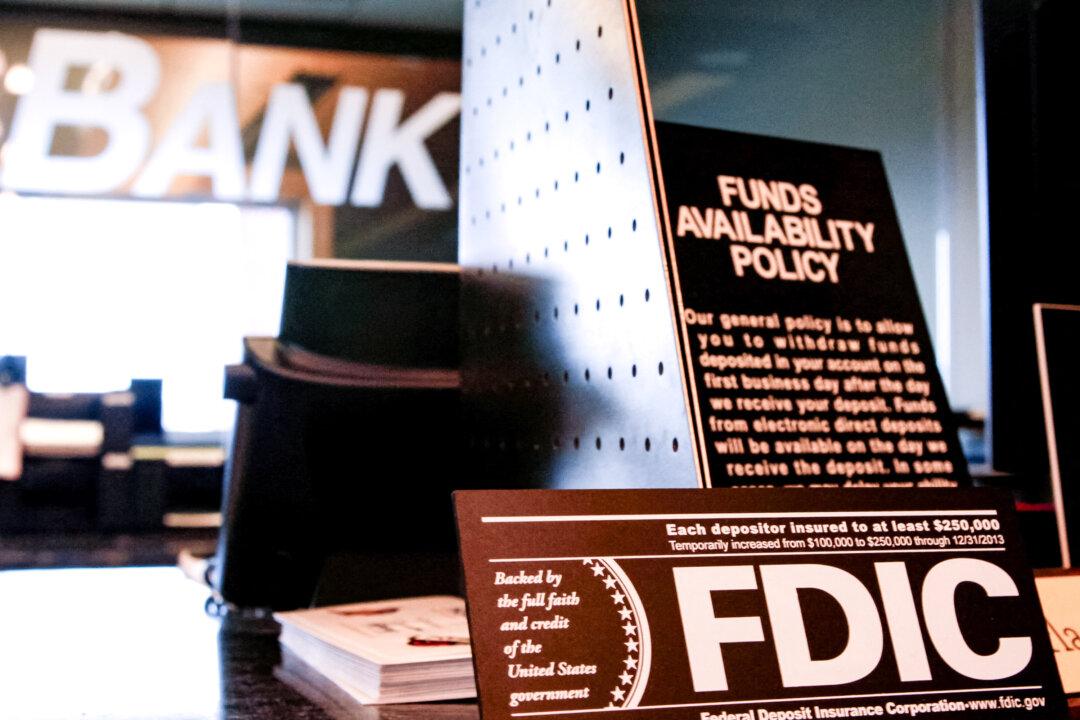
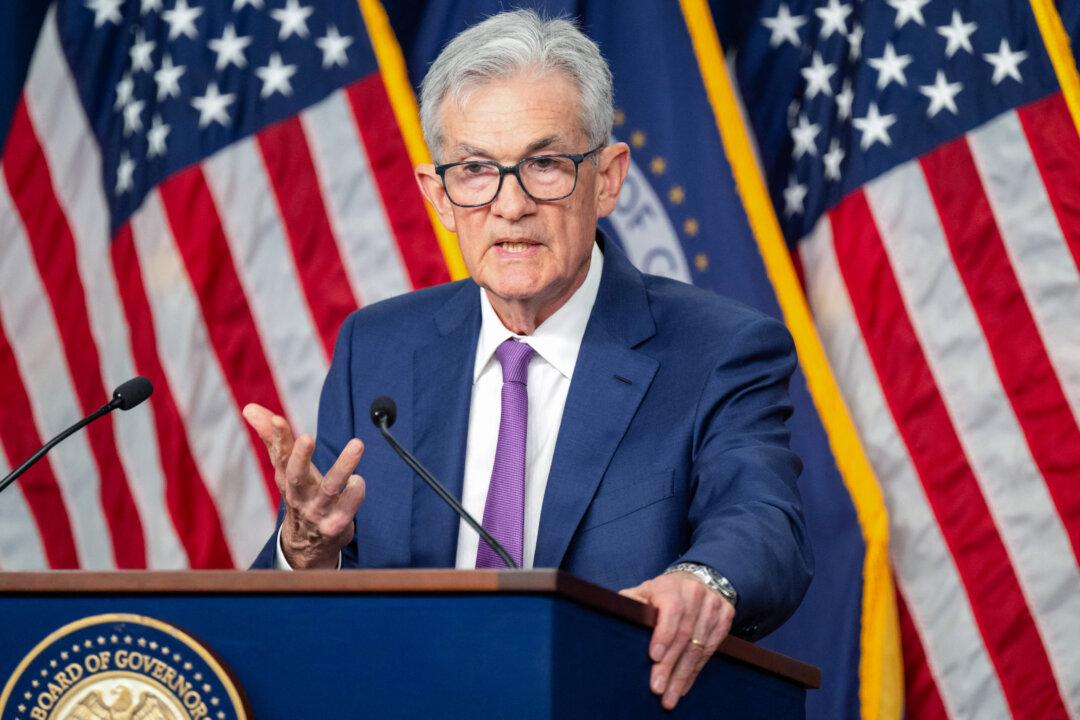
Markets now suspect that there could be another rate rise beyond what the Federal Reserve has hinted. “Higher for longer” is the market expectation for Fed policy, meaning higher rates for a longer period. That’s bearish for medium- and long-term bonds, as evidenced by the 30-year Treasury crossing the 5 percent mark for the first time since 2009 and 4.9 percent for the 10-year.While the jobs surprise is a good sign for the economy in the short term, the longer term is troubling. Businesses will need to refinance debt at higher cost and consumers will see the rate increase reflected in their purchases and, especially, in higher housing costs. It increases the risk of recession. It also adversely affects banks that hold bonds as part of their portfolio, as occurred with Silicon Valley Bank and other banks that failed earlier this year.


What has been happening is that the so-called “bond vigilantes” are taking account of U.S. spending, judging the risk of a raising rate environment, and demanding a higher return for the money they lend. The vigilantes are concerned that, as reflected in the $2.2 trillion deficit for the current fiscal year, together with the failure of the GOP House to pass the 12 separate appropriations bills as baseline for negotiations with Senate Democrats, will cause Congress to “punt” into yet another continuing resolution, the same as Congress has done since 1997. There seems to be no willingness to alter Congress’s spendthrift behavior.
We think GDP for the third quarter will print at 1.5–2.0 percent and that consumer spending will tighten going into the fourth quarter and the first quarter of 2024. We expect just middling growth and continuing inflation commencing in the first quarter as consumer spending slows due to peoples’ credit being choked out. GDP for the fourth quarter will print around 1 percent.
It will be the return of “stagflation”—the portmanteau of inflation and stagnation.
Other Data Points
The Institute for Supply Management’s Manufactuer’s Purchasing Managers Index (PMI) for September showed the industrial economy is contracting, but slower than last month, at 49 versus 47.6 in August. (A reading below 50 signals contraction.) Very notably, the “prices” portion of the index dropped 4.6 points, meaning that prices were decreasing faster. On the other hand, the ISM Services Index showed the service economy expanding, but more slowly, also, at 53.6 versus 54.5 in August.The Job Openings and Labor Turnover Survey (JOLTS) for August, released Oct. 3, grew, showing 690,000 more job openings in August than in July, but with just 38,000 separations.
Building permits in August, released July 19, were at a seasonally adjusted annual rate of 1,543,000. This is 6.9 percent above the revised July rate of 1,443,000, but is 2.7 percent below the August 2022.
Privately owned housing starts in August were at a seasonally adjusted annual rate of 1,283,000. This is 11.3 percent below the revised July estimate of 1,447,000 and is 14.8 percent below the August 2022 rate of 1,505,000.
For August, personal income and outlays, released Sept. 29, showed disposable personal income up 0.2 percent in current dollars, but down -0.2 percent in chained 2012 dollars. (“Chained dollars” is a measure of inflation that takes into account changes in consumer behavior in response to changes in prices.) Personal income in current dollars was up 0.4 percent.
The August Personal Consumption Expenditures (PCE) Index, excluding food and energy, released the same day, and reported to be the Federal Reserve’s preferred measure of inflation, printed at 3.9 percent, down four-tenths of 1 percent from July. PCE inflation, also called “headline inflation,” printed at 3.5 percent, up from July’s 3.4 percent.
The IBD/TIPP Economic Optimism Index for August sank to a 12-year low in October as confidence in the near-term economic outlook crashed to the lowest level in the poll’s history at 36.3 percent, down 16 percent.