Something more dramatic than the loss of 3,000 American lives happened on September 11, 2001. We seem to have lost our nerve and taken leave of our financial senses. We launched a series of costly wars in Afghanistan and Iraq (with incursions elsewhere) and passed freedom restrictions disguised as Patriot Acts, and added costly laws and safety cushions that swelled our national debt 10-fold in just 22 years.
Bin Laden is dead, but did he win after all by killing our spirit of enterprise, risk-taking and freedom?
We took a four-year balanced-budget winning streak (1998 to 2001) and turned it into a 22-year losing streak, including trillion-dollar deficits in each of President Obama’s first four years, and now all four of the COVID and post-COVID 2020s fiscal years. Next week, we mark a sad first – the first rising deficit in a time of rising GDP with no American overseas wars – assuming you don’t count Ukraine as a U.S. war. (President Biden famously yanked America troops out of our 20-year Afghanistan engagement in 2021).
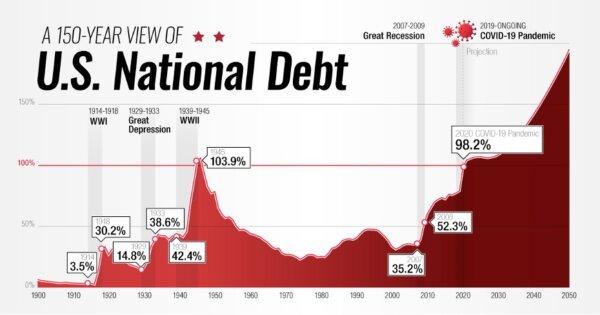
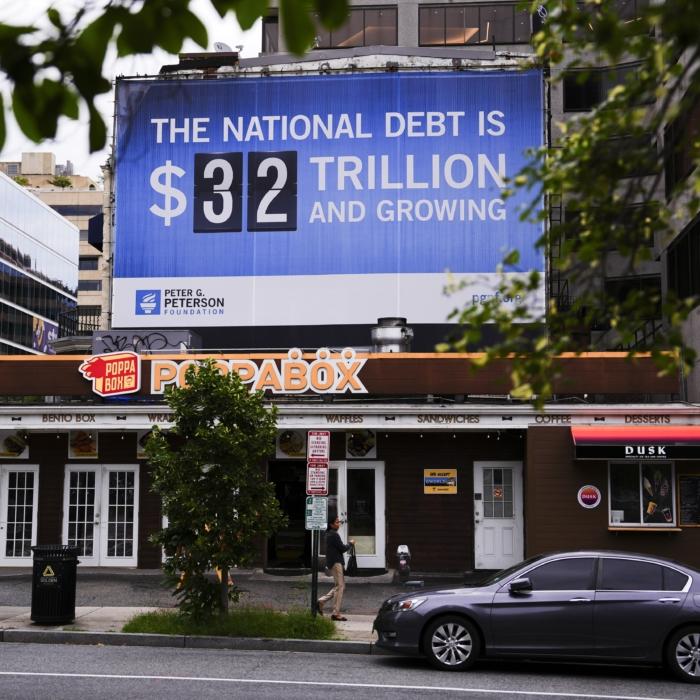
From 1998 to 2001, Presidents Clinton, Bush and the Republican Congress paid down the national debt by $560 billion with four consecutive surpluses: $69.3 billion (1998), $126.6 billion (1999), $236.2 billion (2000) and $128.4 billion (2001), but the first post-9/11 budget (2002) delivered a $157.4 billion deficit with barrels of red ink to follow. The total national debt on September 30, 2001, was $3.3 trillion. Today, it is $33 trillion, 10-fold higher. Measured by debt-to-GDP it was 35% in 2007 but 100%+ now.
At the end of this week, September 30, the 2023 federal fiscal year wraps up, and the Biden team and Congress have driven the deficit over $2 trillion from last year’s $1.38 trillion. We’ll soon know the end result, but the nonpartisan Committee for a Responsible Federal Budget (CRFB) projected $2 trillion.

What caused the increase? Let’s ask White House Press Secretary, Karine Jean-Pierre. On Tuesday, September 5, a Time reporter asked her, “Why is the deficit increasing?” She responded, “It can be year to year—it can be very volatile.” He followed up; she repeated: “I just laid it out, it can be very volatile. … That’s the way it is, from year to year, it can be variable.” Then, a reporter from The NY Post interjected, “Why?” She shot back, “Talk to an economist, and they’ll tell you specifically.” (NY Post, Sept. 5)
I guess it’s hard to find good help these days, but it’s pretty easy to explain a rising deficit. It doesn’t take an economist. Ask any corporate officer, or a savvy shopper – it’s lower receipts, higher expenditures, or some of both. You can’t explain it in 2023 by wars or recessions (none this year). You can’t explain it by emergency COVID benefits (no longer applicable). It’s big new spending programs, funding for Ukraine (billions disappearing into corrupt hands), lots of folks retiring early, plus rising Social Security benefits.
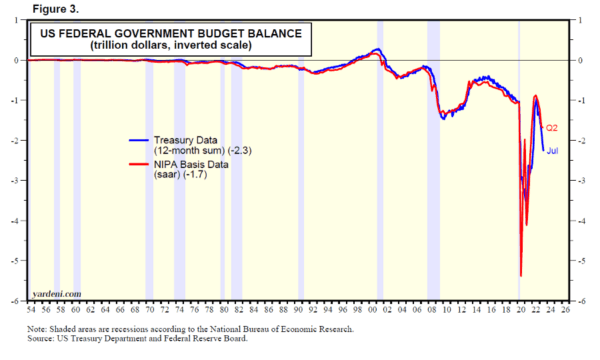
As a result, the 12-month (year-over-year) deficit has more than doubled from a low of $1.0 trillion as of July 2022 to a current $2.3 trillion through July 2023 (see chart, below), according to U.S. Treasury data.
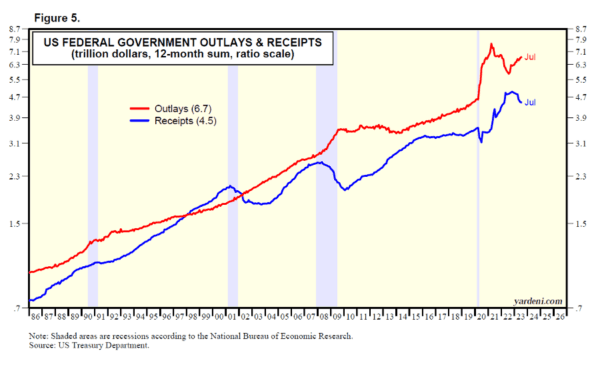
If the President’s press secretary called the boss’s Treasury Department, she would know that there was a half-trillion decrease in income tax receipts, from a record high $2.7 trillion, over the 12 months through last April, to $2.2 trillion over the 12 months through this July, due mostly to last year’s surge in capital gains revenues, as many cashed in for retirement in 2021 or early 2022, vs. staying invested since 2022.
Next, we must address rising interest rates, engineered by the rapid 5% ratcheting up of the Fed Funds rate since April 2022. Servicing the $33 trillion national debt will now be much more expensive. Long-term rates are also up, as investors have not been so enthusiastic about bidding up 5-to-30-year Treasury bonds, sending yields over 4.3%, near multi-year high (4% is not historically high, since the “old normal” is around 4%, but the “new normal” has been near zero, since shortly after the Financial Crisis of 2008.)
As covered here recently, Fitch Ratings downgraded U.S. government debt from AAA to AA+ on August 1, and there was no immediate reaction of consequence, but the long-term consequence will be a return to the “old normal,” pushing annual interest rate service costs above $1 trillion on our rising federal debt.
Due to the huge spending appetite of the current President and Congress, the Treasury will be selling or auctioning off lots of new notes and bonds throughout the fourth quarter and next election year, all while the Fed’s new quantitative tightening (QT) program continues to shrink the Fed’s holdings of Treasuries by about $60 billion per month. Additionally, the recent banking crisis is causing many commercial banks to let their portfolios of Treasury securities mature, to divest themselves of long-bond maturity risks.
This means the U.S. must rely on the kindness of strangers (overseas investors, for the most part) to keep Treasury yields “low” (at 5% or less), or else rates and the deficit will balloon even higher, faster. Such a faith in China or Europe is a weak reed to lean on, considering the weakness of those economies now.
We can’t lay everything at the feet of Obama bin Laden and his terrorist ilk, but something turned America around in 2001: We turned from surpluses to debt, high growth to slow growth, and we went on strike:
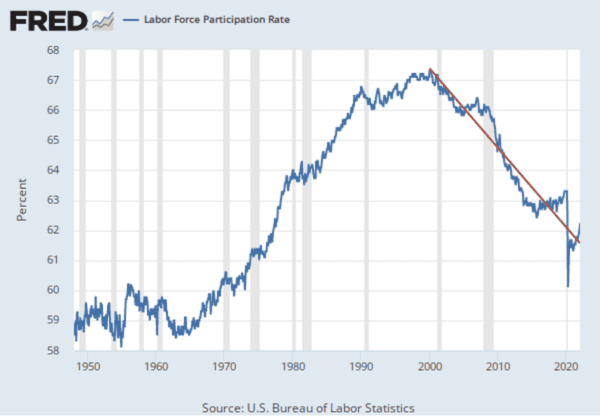
OK, we didn’t exactly go on strike, but the percentage of healthy adults of working age participating in the labor force peaked in 2000 and has been going down ever since, particularly since COVID struck.
| Years | GDP per Year | Per Capita |
| 1950-1999 | +3.6% | +2.4% |
| 2000-2022 | +2.0% | +1.2% |
We also seem to care less about debts. So far in the 2020s, deficits exceed $9 trillion: $3.132 trillion in fiscal year 2020, $2.776 trillion in 2021, $1.375 trillion in 2022, and approximately $2 trillion in 2023.
This 21st Century experiment in Modern Monetary Theory (MMT) has backfired, as it always does, but big-time, since we are so big. Maybe we could learn some old-time economic religion if somebody could send a copy of Henry Hazlitt’s “Economics in One Lesson” (1946) to the Biden White House, with a second copy to his Press Secretary….and heck, why not 535 more copies to each member of Congress?!