

- 2009: +45.3 percent
- 2010: +18.0 percent
- 2011: -0.8 percent
- 2012: +17.9 percent
- 2013: +40.9 percent
- 2014: +14.7 percent
- 2015: +7.0 percent
- 2016: +8.9 percent
- 2017: +29.6 percent
- 2018: -2.8 percent
- 2019: +36.7 percent
- 2020: +44.9 percent
- 2021: +22.2 percent
Ben’s math is correct. As such, the reader’s email suggests the 2022 drawdown is nothing to be concerned with because of gargantuan percentage returns in previous years. To be exact: “Yes, I gave up 2021 gains, but I still have all the previous years in the bank.”
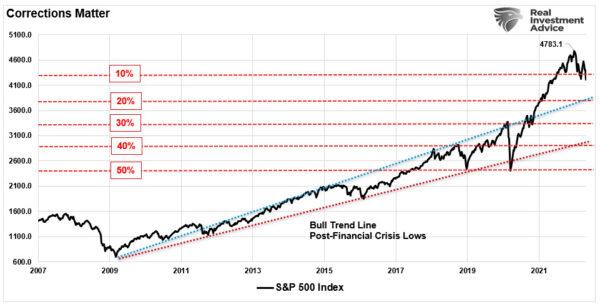
Unfortunately, that isn’t how math works, and therein lies the investing lesson that we must learn. As shown, corrections that seem small on a percentage basis can wipe out years of gains.
Investing Lesson—How Math Works
“The following chart proves my point, in the long-term; bear markets are harmless (and relatively small) as the chart indicates.”I have recreated the “cumulative percentage return” chart that the reader provided from First Trust for data consistency.
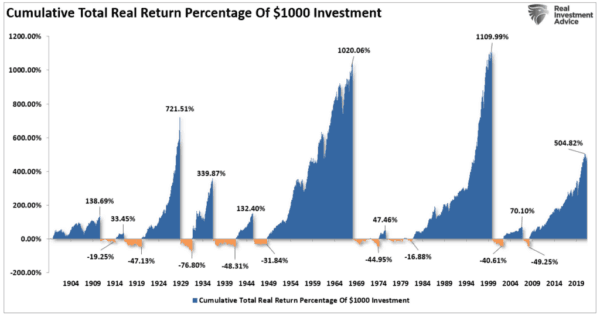
If you fail to analyze the chart above, you would undoubtedly agree that market drawdowns are significantly smaller than the previous advances.
The problem is that your assumption is entirely wrong. The investing lesson buried in the chart above is the basic understanding of math. The chart uses percentage returns which is highly deceptive if you don’t examine the issue beyond a cursory glance. Let’s take a look at a quick example.
- 1000 to 2000 = 100 percent return
- The index rises to 3000 = 200 percent return
- Going on to 4000 = 300 percent return
- …
- And continues to 8000 = 700 percent return
Why worry about a 50 percent correction in the market when you just gained 700 percent. Right?
Here is the problem with percentages.
A 50 percent correction is a subtraction of 4000 points, reducing your 700 percent gain to just 300 percent.
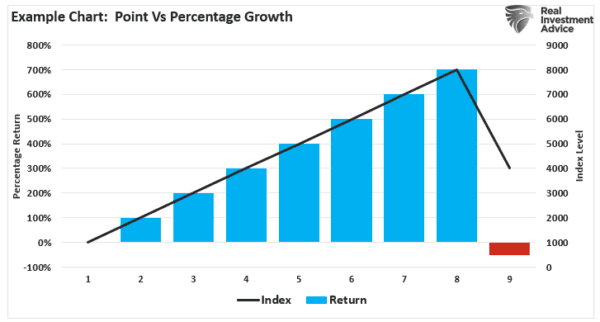
As shown in the example, the small drawdown seems innocuous until you realize it clipped 4000 points from the index. The problem now becomes the issue of regaining those 4000 lost points to break even.
The Math Can Be a Killer (of Financial Goals)
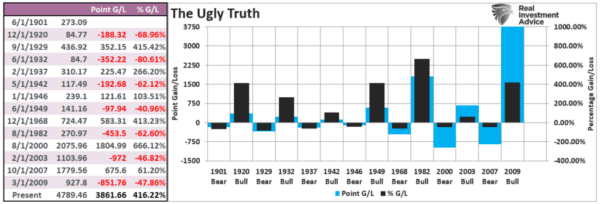
When measuring markets in percentage terms, the math is very deceiving. Such is critical when you realize that a 100 percent gain and a 100 percent loss are the same.The chart below reconstructs the percentage gain and loss chart above into actual point changes. In this form, we see that most of the advances in bull markets get subsequently destroyed in bear markets.
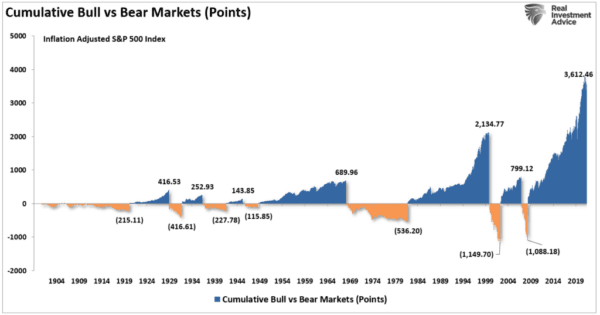
The chart and table below show both the point and percentage gain or loss for each market cycle to clarify that point. Again, the “math” is straightforward. Bear markets are devastating to financial outcomes.
As is always the case, the “math of loss” matters over the long term. Such is why after 3-major bull market cycles since 1980, most Americans are woefully unprepared for retirement.
Time Matters
If you have discovered the secret to eternal life, then stop reading now.For the rest of us, mere mortals, time matters.
Unfortunately, most investors remain woefully behind their promised financial plans. Given current valuations and the ongoing impact of “emotional decision making,” the outcome is not likely to improve over the next decade.
For investors, understanding potential returns from any given valuation point are crucial when considering putting their “savings” at risk. Risk is an important concept as it is a function of “loss.” The more risk in a portfolio, the greater the destruction of capital when reversions occur.
In the end—yes, market corrections are indeed very bad for your portfolio. However, before sticking your head in the sand and ignoring market risk based on an article touting “long-term investing always wins,” ask yourself who benefits?
This time is “not different.”
The only difference will be what triggers the subsequent valuation reversion when it occurs.
If the last two bear markets haven’t taught you this by now, I am unsure what will.
Maybe a third time will be the charm.


