This copy is for your personal, non-commercial use only. Distribution and use of this material are governed by our Subscriber Agreement and by copyright law. For non-personal use or to order multiple copies, please contact The Epoch Times Reprints.
Company representatives from Verizon, Goodwill, Kaiser Permanente, and UPS, right, talk with potential applicants during a job and resource fair in Atlanta, Ga., in a file photo. Bob Andres/Atlanta Journal-Constitution via AP
[Note: If you wish to skip detailed analysis and data support, simply scroll down to “Opinion and Outlook” and “GDP Prognostication.”]
The August jobs report printed this morning at 187,000 new jobs, identical to the 187,000 new jobs that had originally printed in July, but the July number was revised down by 30,000 in the release today. Total revisions for June and July were revised down by 110,000 jobs, yet another of the big downward revisions we have seen in recent months. The June jobs report also had a huge 110,000 downward revision for April and May. July revised May and June numbers down by another 49,000.
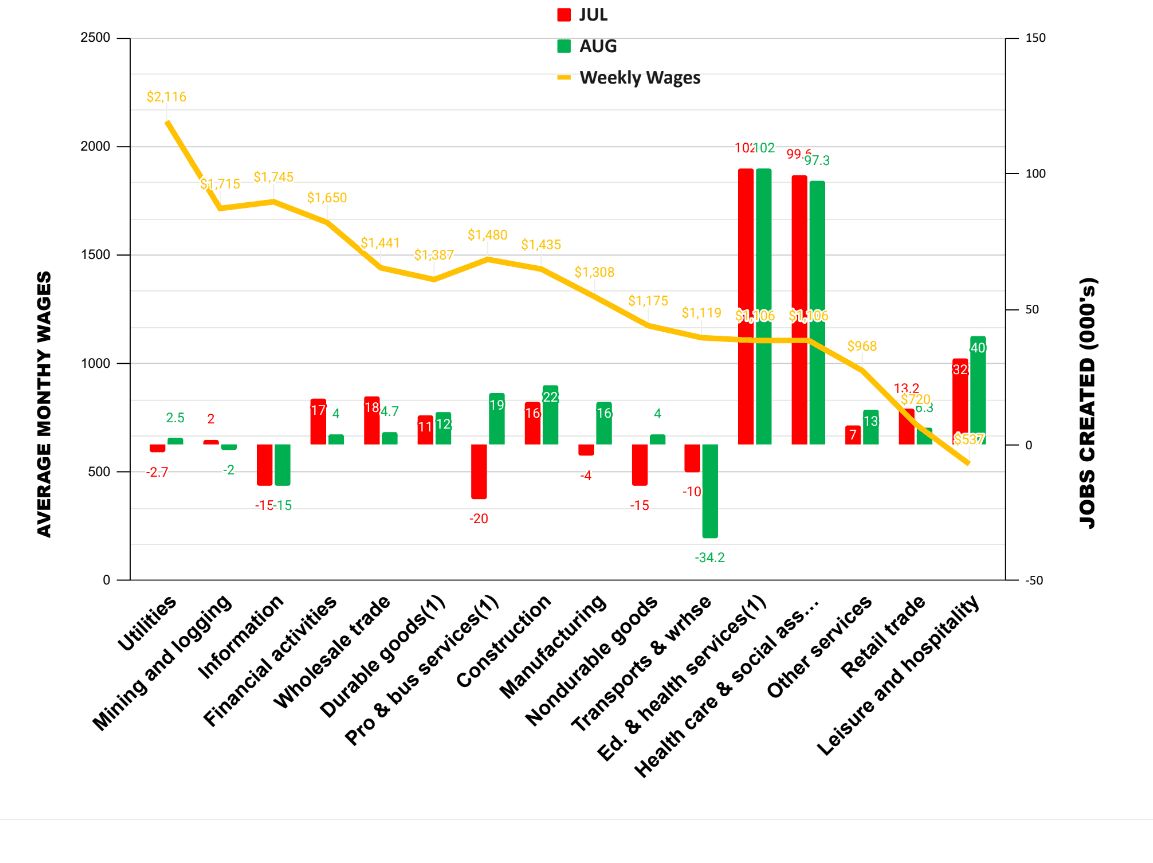
Let’s turn to our exclusive schedule of August and July Jobs Creation by Average Weekly Wages.
July and August Jobs Creation. Source: "August and July Jobs Creation by Average Weekly Wages by Sector"/ The Stuyvesant Square Consultancy 2023, used by permission
As in July, we’re seeing most of the jobs growth in government-supported and subsidized sectors of the economy: education and health services, which includes health care and social assistance. Those elements tend to be immune to cyclical economics. More cyclical job sectors, like transportation and warehousing, information services, and professional and business services have shown declines or just tepid growth. Temporary help services, usually a negligible element of job creation, has lost an average of 26,000 jobs each of the last three months. That sector is usually one of the first signs of an economic slowdown.
The unemployment rate rose by 0.3 percentage point, to 3.8 percent, in August, and the number of unemployed persons increased by 514,000, to 6.4 million. Annual real wages, which we present quarterly, and calculate after taking account of the July trimmed mean inflation rate of 4.1 percent, increased by only a minuscule 1.05 percent in the aggregate. (See our report next month for a detailed breakdown by sector.)
Other Data Points
The Institute for Supply Management’s Manufactuer’s Purchasing Managers Index (PMI) for August, released this morning, showed the industrial economy is contracting, but slower than last month, at 47.6 versus 46.4 in July. (A reading below 50 signals contraction.) On the other hand, the ISM Services Index for July, the last available, showed the service economy expanding, but more slowly, also, at 52.7 versus 53.9 in June. (The August Services report will be released Sept. 6.)
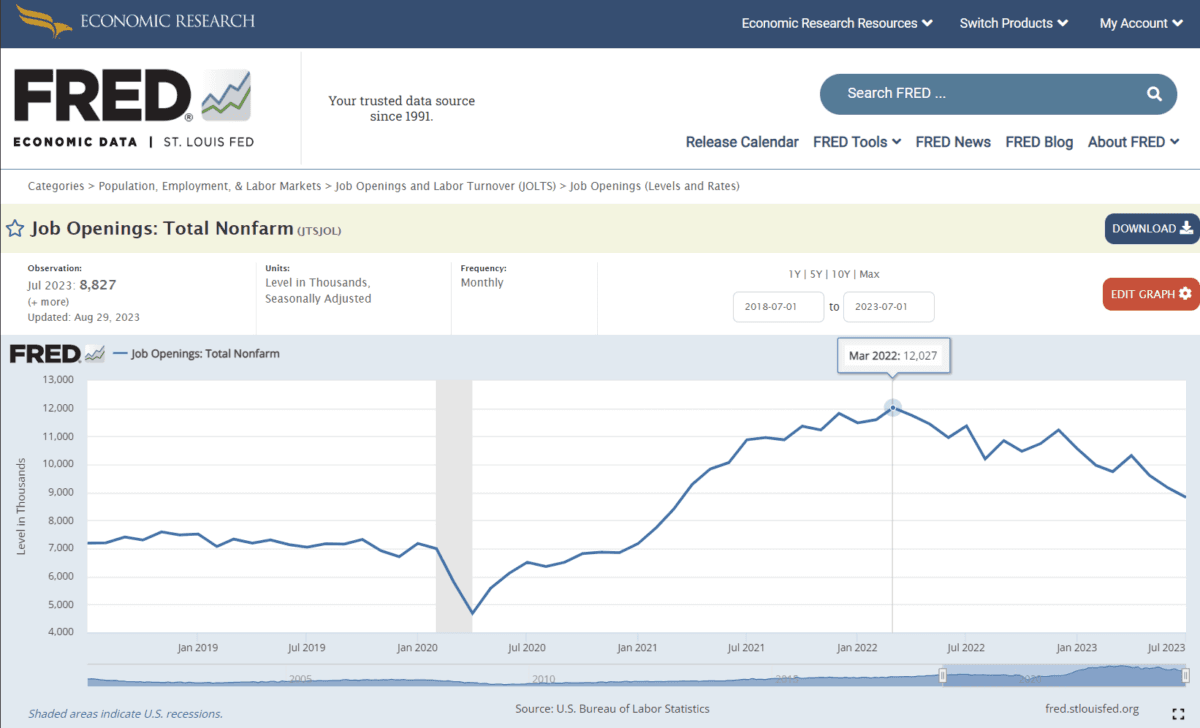
The Job Openings and Labor Turnover Survey (JOLTS) for July, reported Aug. 29, continued its decline, showing 338,000 fewer job openings in July than in June, and there were 253,000 fewer separations. This continues the precipitous decline in job openings we’ve seen since the peak of 12,027,000 in March 2022 to 8,827,000 as seen in this chart.
Source: "JOLTS Jobs Openings Since July 2018 to July 2023" / Federal Reserve Bank of St. Louis
We believe the long-anticipated recession has affected hiring practices so that fewer job openings have been created. Accordingly, the predicted recession—which would otherwise result in layoffs—could very possibly result in a so-called “soft landing.”
Building permits in July, released Aug. 16, were at a seasonally adjusted annual rate of were at a seasonally adjusted annual rate of 1,442,000. This is 0.1 percent above the revised June rate of 1,441,000, but is 13.0 percent below the July 2022 rate
of 1,658,000.
Privately owned housing starts in July were at a seasonally adjusted annual rate of 1,452,000. This is 3.9 percent
(±16.0 percent) above the revised June estimate of 1,398,000 and is 5.9 percent (±16.1 percent) above the July
2022 rate of 1,371,000.
For July, personal income and outlays, released Aug. 31, showed disposable personal income was unchanged in current dollars and down -0.2 percent in chained 2012 dollars. (“Chained dollars” is a measure of inflation that takes into account changes in consumer behavior in response to changes in prices.) Personal income in current dollars was up 0.2 percent. Since January 2021, real disposable personal income per capita has declined over $3,000 because of inflation and the economy.
The July Personal Consumption Expenditures (PCE) Index (excluding food and energy), released Aug. 31, which is reported to be the Federal Reserve’s preferred measure of inflation, edged up, to 4.2 percent from 4.1 percent. PCE inflation, also called “headline inflation,” printed at 3.3 percent, up from June’s 3.0 percent. The spike could signal continued rate increases by the Fed.
The IBD/TIPP Economic Optimism Index for August, printed Aug. 8, fell 2.4 percent, to 40.3. Anything below 50 signals pessimism.
Opinion and Outlook
Trustworthy Numbers?
I’m quite troubled by the large, six-figure, downward jobs revisions—two in three months—affecting the Bureau of Labor Statistics (BLS) data. Congress should be, too. This has likely caused a more sanguine view of the economy, in our view, and we cannot help but suspect these huge overstatements of jobs creation is part of President Joe Biden’s reelection campaign’s effort to spin “Bidenomics” in a positive light. Friday jobs reports generally tend to make big business headlines at the time they’re released and affect markets, but the revisions—which typically much less than six figures—tend to draw far less attention.
Readers may recall that back in October 2012, legendary General Electric CEO Jack Welch alleged that the BLS jobs data had been manipulated to make them appear better than they were. The September 2012 Jobs Report, released the following October, was influential because it was the last one before voters headed to the polls for the November elections, when Barack Obama faced Mitt Romney. Mr. Welch was pilloried by the media for his claim, which reminded him that the BLS statisticians are career public employees above the influence of politics.
But it later emerged that Mr. Welch’s suspicions were well-founded. A U.S. Census employee had been falsifying data for the Household survey, which was used to calculate the unemployment rate, and New York Post business columnist John Crudele reported that “a knowledgeable source says the deception went beyond that one employee—that it escalated at the time President Obama was seeking reelection in 2012 and continues today.” Mr. Crudele offered his source and the other support for his story to the Labor Department’s inspector general, but reported that nobody had returned his calls. The establishment media then proceeded to pillory crudele for what it termed a “reckless” story.
I think there is reason to be circumspect about the jobs data, given prior claims from this administration.
That said, given today’s revisions, the average three-month jobs creation is just 150,000 new jobs. Not bad, but just about the range of new jobs creation that are generally considered to be necessary to absorb population growth.
More disconcerting is the slowdown in jobs creation as reflected in the JOLTS report and the slowing of the economy as related in the ISM Manufacturing Index. Things are certainly slowing down, but at a moderate pace. As reflected in the JOLTS chart above, we could be in for a “soft landing,” particularly if the Federal Reserve moves toward its 2 percent inflation target more slowly. The policy meeting of the Federal Open Market Committee in Sept. 19–20, which includes the Fed’s Summary of Economic Projections, or “dot plots,” will give us more data. Fed Chair Jerome Powell recently reiterated his commitment to a 2 percent inflation rate, but the timeline for achieving it is nebulous. Given the increase in headline PCE inflation (i.e., from 3.0 to 3.3 percent, as of July 23), we’re likely to see additional rate hikes if the Fed doesn’t get “gun shy” about raising rates and causing a recession.
GDP Prognostication
We believe a recession, if there is one, will be mild, largely because businesses have already moderated their hiring and inventory stockpiles. They’re also in the midst of doing price, revenue, and income estimates for next year, so moderating their expectations so as not to disappoint Wall Street analysts (better an earnings “beat” than a “miss” insofar as the stock market is concerned). Accordingly, we think things will continue to slow. We think headline inflatin will continue at or above 3 percent through the end of the year and the Fed will remain patient and not raise rates unless the data shows a substantial spike in the headline number to 4 percent or above. Third-quarter GDP will print between 0.75–1.25 percent.
If the United Auto Workers (UAW) strike is not settled by the deadline in two weeks, we expect that GDP figure will fall by as much as a quarter percentage point (i.e., t0 0.50–1.00 percent in the current quarter). Both sides seem to be dug in and a strike could move us into recession in the fourth quarter, sooner than we had anticipated.
If the Fed holds firm to its 2 percent inflation target, and signals the same, we expect a maudlin to recessionary economy of zero percent to 1.0 percent in the fourth quarter, provided the UAW strike is settled.
Our commentaries most often tend to be event-driven. They are mostly written from a public policy, economic, or political/geopolitical perspective. Some are written from a management consulting perspective for companies that we believe to be underperforming and include strategies that we would recommend were the companies our clients. Others discuss new management strategies we believe will fail. This approach lends special value to contrarian investors to uncover potential opportunities in companies that are otherwise in a downturn. (Opinions with respect to such companies here, however, assume the company will not change).
The views expressed, including the outcome of future events, are the opinions of the firm and its management only as of September 1, 2023, and will not be revised for events occurring after this document was submitted to The Epoch Times editors for publication. Statements herein do not represent, and should not be considered to be, investment advice. You should not use this article for that purpose. This article includes forward-looking statements as to future events that may or may not develop as the writer opines. Before making any investment decision you should consult your own investment, business, legal, tax, and financial advisers. We associate with principals of TechnoMetrica, publishers of the TIPP Index on survey work in some elements of our business unrelated to that index.
J.G. Collins is managing director of the Stuyvesant Square Consultancy, a strategic advisory, market survey, and consulting firm in New York. His writings on economics, trade, politics, and public policy have appeared in Forbes, the New York Post, Crain’s New York Business, The Hill, The American Conservative, and other publications.