At 150,000 New Jobs and Another Fed Pause, the Economy Is Set for ‘Stagflation’

At 150,000 New Jobs and Another Fed Pause, the Economy Is Set for ‘Stagflation’
(Shutterstock)
J.G. Collins
11/3/2023
Updated:
11/6/2023
0:00
Commentary

This morning’s jobs numbers fed the bond bulls, printing at 150,000 new jobs, significantly below the consensus market expectations of 180,000. Revisions, once again, were revised down by a net 101,000 jobs, largely offsetting the net 139,000 more jobs that were claimed for July and August in last month’s jobs report. Government added another 51,000 jobs, included in the 150,000 number. (Oddly, it is the third month in a row that government has added that same number of jobs.)

The unemployment rate printed at 3.9 percent, up slightly from last month. But the labor force rate declined slightly to 62.7 percent. The Household Survey, which is a poll to estimate the number of people employed, as opposed to the number of jobs created, estimated the number of people employed had fallen by 348,000.

This morning’s release triggered what we believe to be a sanguine view of the economy, and particularly of Federal Reserve policy, with markets expecting a continuing pause of Fed rate hikes or even a rate cut within some reasonably short time frame. As rates on the 10-year Treasury and other rates declined, equities rose, with the Dow Jones Industrial Average up 300 points at this writing.

Let’s turn to our exclusive analysis of the October jobs by average weekly wages (as depicted in the chart below).

(Source: October JobPrivate Sectors by Average Weekly Wages from Bureau of Labor Statistics data/The Stuyvesant Square Consultancy)

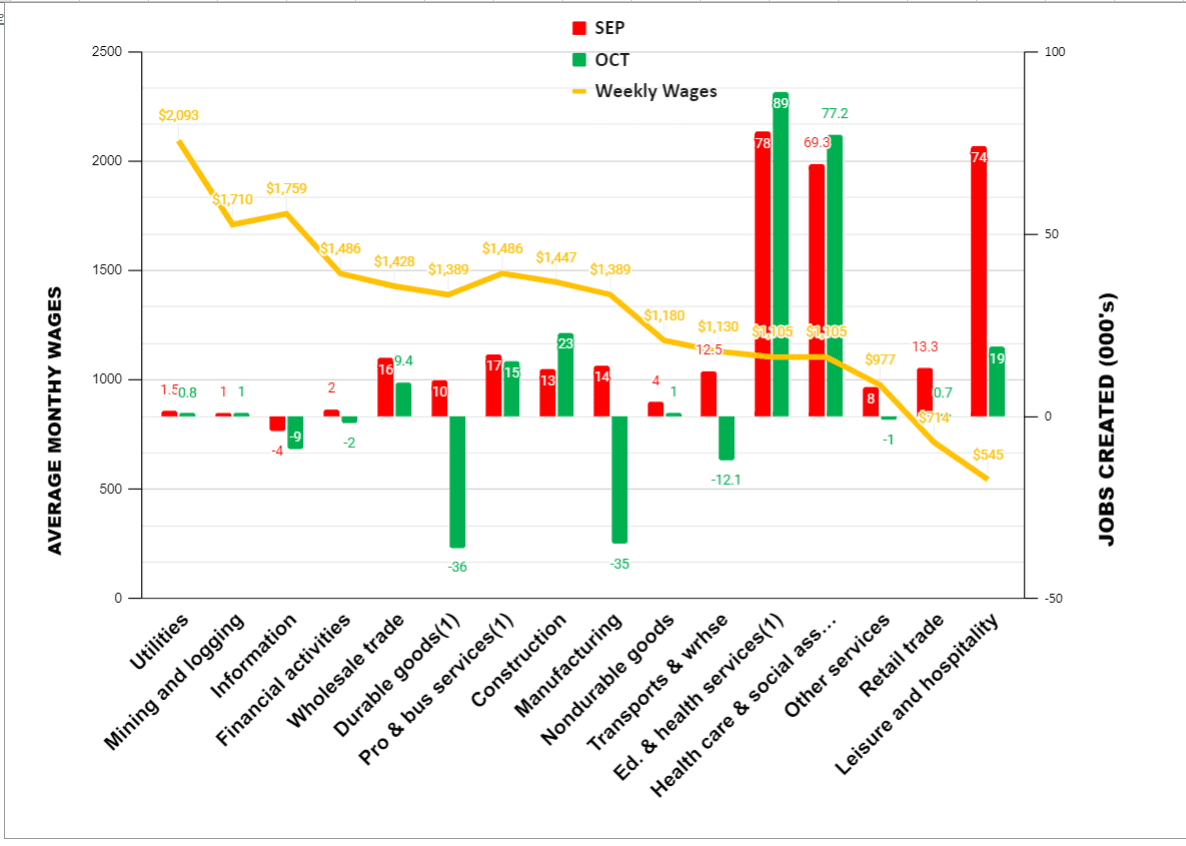
Slower job growth occurred in all areas, save for construction and education and health services (which includes health care and social assistance), which derives much of its support from government, indicates a slowing of the economy, despite the stunning third-quarter GDP of 4.9 percent.

The job losses in manufacturing comport with other data from the Institute for Supply Management’s Manufacturing Survey, discussed further below. Note that it includes more than 33,000 jobs lost in auto manufacturing, presumably from the recently settled United Auto Workers strikes.

We are concerned that the Federal Reserve has shown the white flag on inflation sooner than it should have. Wednesday’s announcement that the Fed has paused rate hikes for a second meeting in a row and that it made no changes to the quantum of its quantitative tightening (long our preferred means of driving down inflation) is disconcerting, in our view. Here’s why:
  1. While “headline inflation” is down, relative to prior measures, inflation in those items that make up the daily cost of living are considerably above the “headline” number. Limited service food away from home, the kind of “grab ‘n go” food of office workers, sales people, and construction workers is up 6.4 percent. Rent is up over 7 percent. Transportation services, which includes things like auto repairs, is up over 9 percent. All those expenses, to say nothing of the cumulative effect of inflation over the last few years, will all add to wage pressure and, hence, continued inflation pressure.
  2. The just concluded UAW strike resulted in generous wage concessions that are likely to be sought by other union workers, particularly in service sector unions and civil service unions.
  3. The pandemic relief for childcare expenses expired at the end of September, so we believe that women, the traditional participants in childcare benefits, will requre a higher wage to participate in the labor force to make up for the loss of the pandemic benefits.
We’re also concerned about continuing pressure from the “chattering classes” of economists, and left-leaning op-ed writers about the “need” to abandon the Fed’s traditional 2 percent inflation target. The reasons for the increase, as stated by Mohamed El-Erian, the prominent economist who heads Queens College, Cambridge, told an X-Space yesterday that the 2 percent target is a random number and that pursuing it can adversely affect employment (i.e., the Phillips curve argument). But with a 2 percent inflation rate, the value of a saved dollar is halved after 35 years. At 3 percent, the value halves in just about 25 years. Moreover, with a 3 percent target rate of inflation, r*, the so-called “natural” rate of inflation, interest rates by lenders will necessarily increase. Finally, the value of the dollar will recede further. (We note that the U.S. Dollar Index, a measure of the resiliency of the greenback relative to a basket of other currencies, fell a wh0le point this morning immediately after the release of the jobs numbers.)

Prognostications

We believe headline inflation will continue in the 3–4 percent range until at least the third quarter of 2024, partly because of the elections in the fourth quarter of that year. Once that is settled, we believe rates will resume their upward trajectory, unless the Fed surrenders to those calling for a higher than 2 percent inflation target. In the interim, we anticipate tepid growth, with GDP in this quarter (fourth quarter 2023) to print at around 1.5 percent and the first quarter of next year to print at 1 percent. Again, we anticipate that the tepid economy will continue with higher inflation, so we will have a period of “stagflation”—the portmanteau for economic stagnation with inflation.

Much of the continued inflation will be the consequence of having to refinance maturing federal debt at much higher rates. It’s estimated that about one-third of government debt will mature over the next year, and at the higher rates the Fed has imposed over the last year or so. That will, itself, cause higher inflation.

GDP has been very difficult to assess, largely, we believe, because consumer spending has exceeded expectations in large part from the wealth effect, whereby people with greater wealth tend to consume more. Pandemic social and economic policy tended to benefit upper-income and wealthy households more than middle-income and poor families.

According to the Federal Reserve Board’s triennial Survey of Consumer Finances (SCF), real median family income, or the midpoint of households, with half above and half below, rose a relatively modest 3 percent, while real mean, or average, family income grew 15 percent from 2019 to 2022. Thus, wealthier households garnered greater wealth from pandemic policies

Other Data Points

The Institute for Supply Management’s Manufacturer’s Purchasing Managers Index (PMI) for October showed the industrial economy is contracting faster, but slower than last month, at 46.7 versus 49 in September. (A reading below 50 signals contraction.) Notably, new orders and hte backlog of orders contracted for the fourteenth month and thirteenth month in a row, both at a faster pace.
 On the other hand, the ISM Services Index showed the service economy expanding, but more slowly in a nine-month trend. The Job Openings and Labor Turnover Survey (JOLTS) for September, released Nov. 1, grew by just 56,000 more jobs openings in September than in August, but with 157,000 separations.
Building permits in September, released Oct. 19, were at a seasonally adjusted annual rate of 1,473,000. This is 4.4 percent below the revised August rate of 1,541,000 and is 7.2 percent below the September 2022 rate of 1,588,000
Privately owned housing starts in September were at a seasonally adjusted annual rate of 1,358,000. This is 7.0 percent (±15.8 percent)* above the revised August estimate of 1,269,000, but is 7.2 percent (±12.1 percent)* below the September 2022 rate of 1,463,000. 
For September, personal income and outlays, released Oct. 27, showed disposable personal income up 0.3 percent in current dollars but down -0.1 percent in chained 2017 dollars. (“Chained dollars” is a measure of inflation that Rtakes into account changes in consumer behavior in response to changes in prices.) Personal income in current dollars was up 0.3 percent.
The August Personal Consumption Expenditures (PCE) Index from a year ago, excluding food and energy, released the same day, and reported to be the Federal Reserve’s preferred measure of inflation, printed at 3.7 percent, down one-tenth of 1 percent from July. PCE inflation, also called “headline inflation,” printed at 3.4 percent, unchanged from August. 
The IBD/TIPP Economic Optimism Index for October sank to a 12-year low in October as confidence in the near-term economic outlook crashed to the lowest level in the poll’s history at 36.3 percent, down 16 percent.
J.G. Collins is managing director of the Stuyvesant Square Consultancy, a strategic advisory, market survey, and consulting firm in New York. His writings on economics, trade, politics, and public policy have appeared in Forbes, the New York Post, Crain’s New York Business, The Hill, The American Conservative, and other publications.
Related Topics