Commentary
March jobs printed at 303,000 new jobs, according to the Establishment Survey released this morning by the Bureau of Labor Statistics (BLS). The number is an estimate of job creation data from a survey of businesses. The figure well exceeded the 212,000 consensus estimate. January and February jobs creation revisions were up by 22,000 jobs, net.
The BLS’s Household Survey, which calculates the number of people taking jobs and is viewed as eliminating workers taking more than one job, showed 173,000 more people working in March than February.
Some 469,000 people joined the U.S. workforce, according to the Establishment Survey, that The Wall Street Journal speculates are largely migrants newly arrived in the United States. However, U.S. Acting Labor Secretary Julie Su attributed the figures to “teenagers, both native born and immigrant” joining the workforce.
Let’s look at our exclusive schedule of March Jobs by Average Weekly Wages.
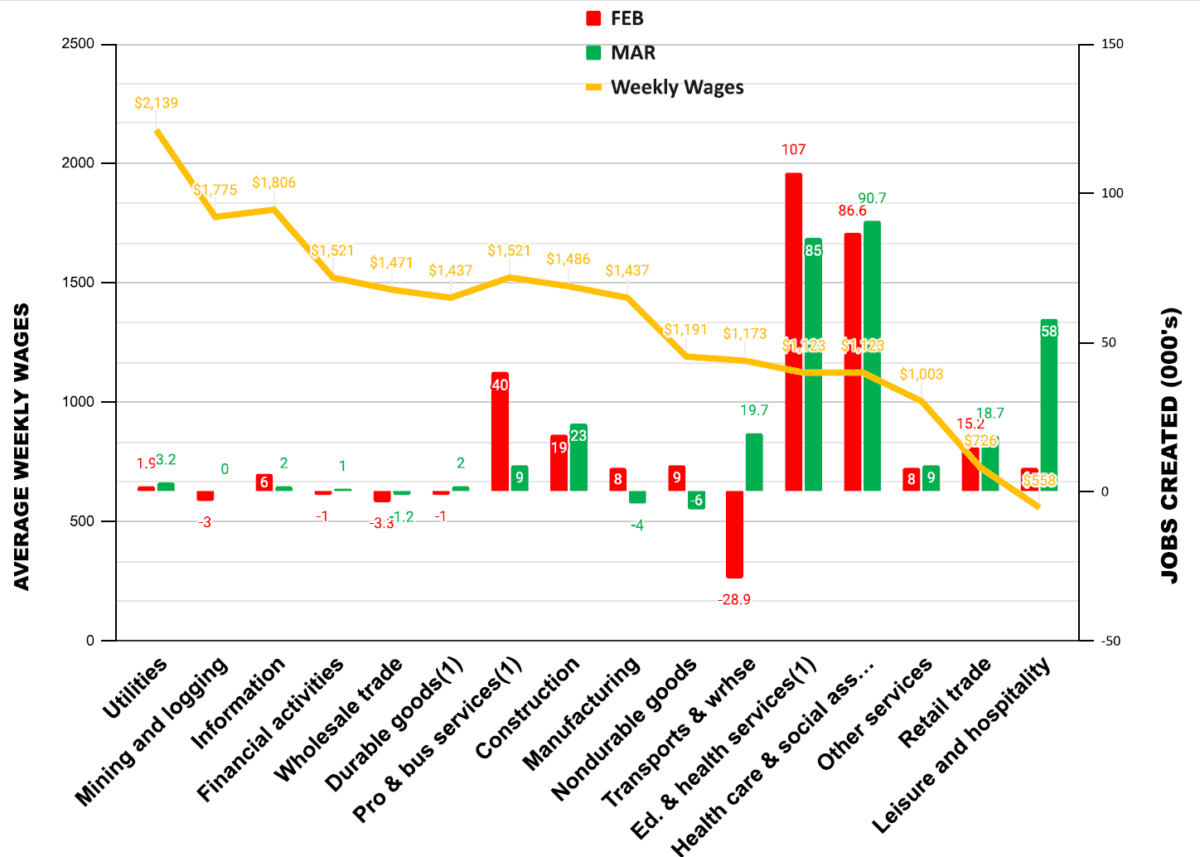
Source: February and March Jobs Creation by Average March wages / The Stuyvesant Square Consultancy
Higher-paying jobs creation was virtually moribund, save for construction, which added 23,000 jobs. Both durable and non-durable goods manufacturing jobs declined. Lower-wage jobs, such as in leisure and hospitality, retail, and other services, and jobs that tend to have government support, like education and health services and health care and social services, generated the majority of the new jobs creation in the Establishment Survey. Moreover, there was a staggeringly high 71,000 new jobs created in government. (We do not include government jobs in our chart.)
Our quarterly detail of real and nominal weekly wages by industry is here:
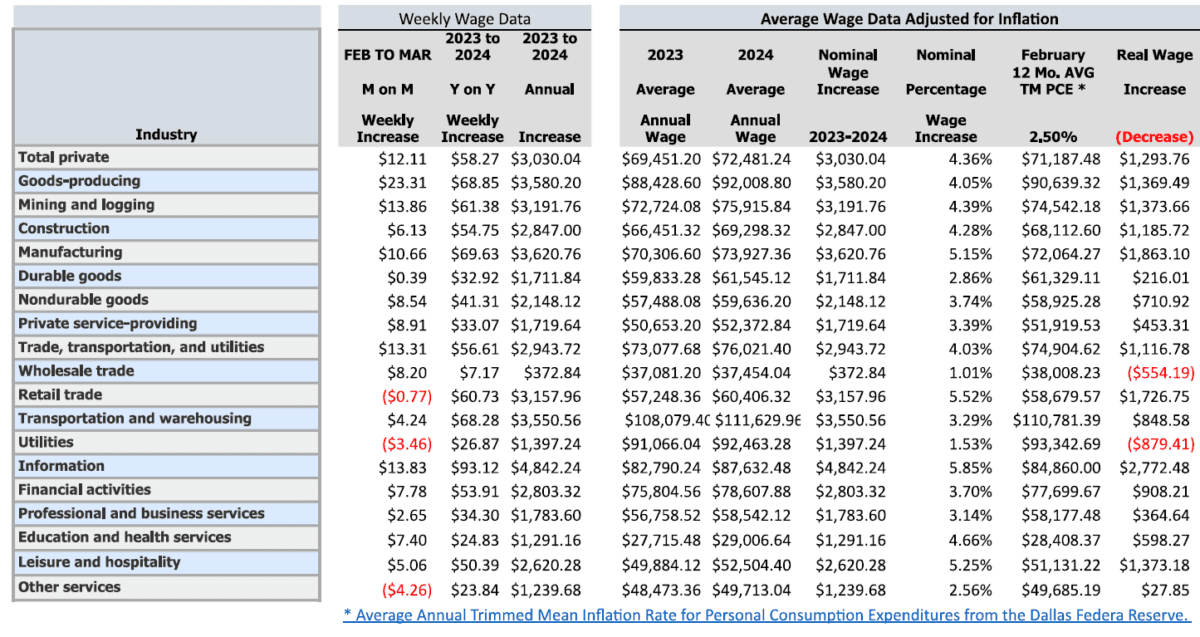
Source: Federal Reserve Bank of Dallas
Economy Generally (Opinion)
At the moment, the United States is at the top of the Group of 7 in terms of its economic performance. But it is arguably the “tallest pygmy,” and much of the good performance is fueled by enormous federal spending and debt, whereby we are on track to spend a trillion dollars every 100 days.We have said for quite some time that the Federal Reserve balance sheet is too large, much larger than it should be, given how far we are from the pandemic (see graph).
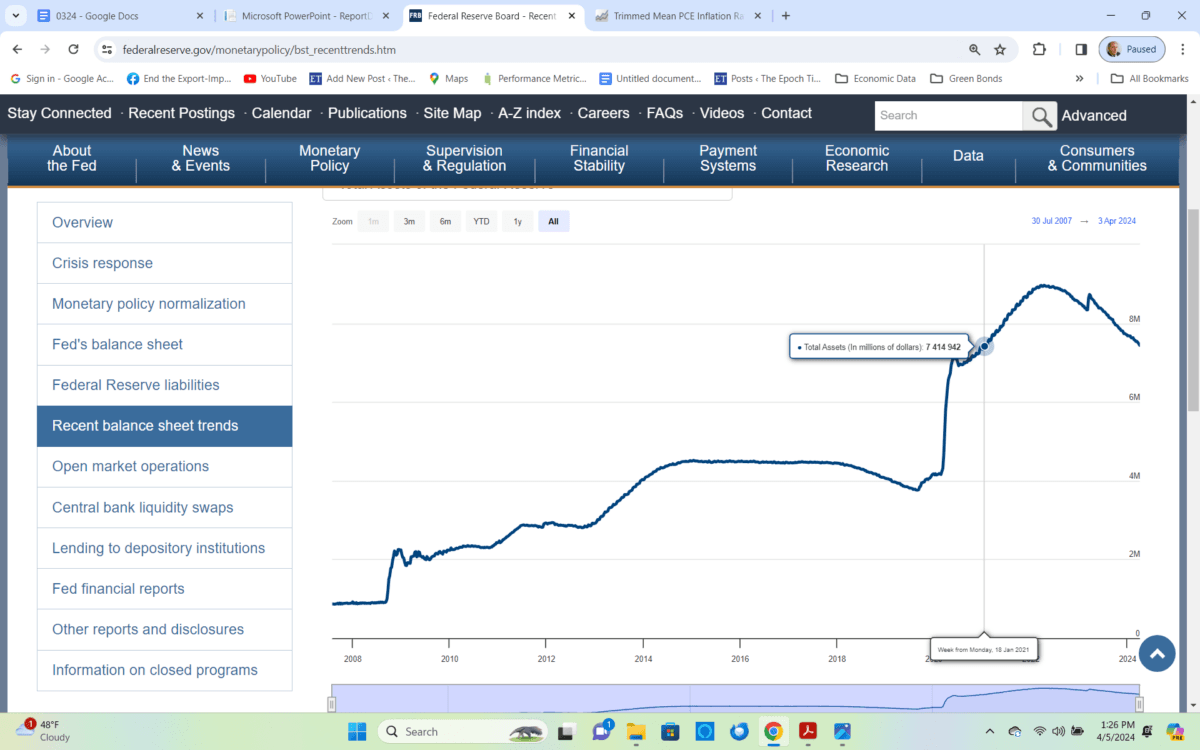
Source: Federal Reserve website
As of April 1, the Fed’s balance sheet was still at $7.4 trillion, well exceeding the $7.1 trillion it was in June 2020, the height of the pandemic. It is now roughly the same $7.4 trillion that it was in January 2021. It has not been reduced at all since President Joe Biden took office.
So, too, has the money supply, M2, continued to be inflated since the pandemic. As of February, M2 stood at $20.783 trillion versus $19.3 trillion in January 2021. It was just $15.3 trillion at the start of the pandemic.
We believe, as we have said for months now, that monetary policy and the Fed’s effort to assure a “soft landing” ahead of the 2024 elections, instead of going through a lengthy, mild recession—or better, a sharp, short recession—continues to be far too accommodating, and has been a longer-term mistake. We see it in the continuing trimmed mean inflation rate, which has ballooned throughout President Biden’s term. Continuing inflation bears out the obvious effect of the excess money supply as seen in this chart:
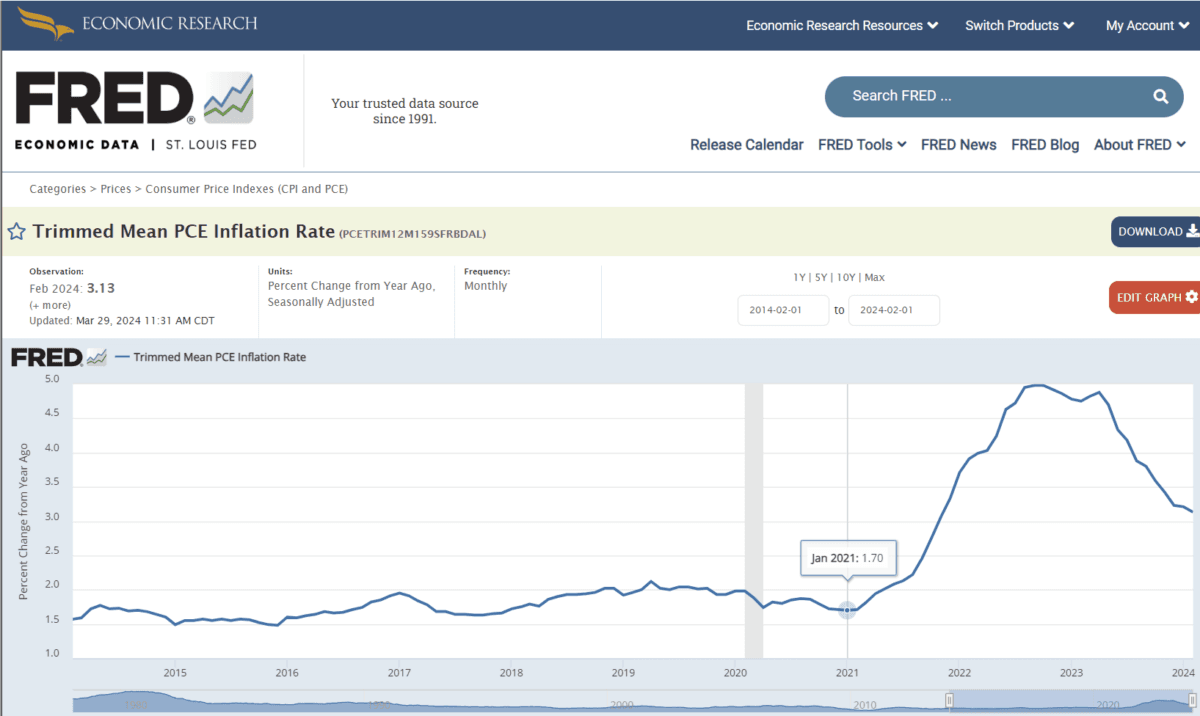
Source: Federal Reserve Bank of St. Louis
The Biden administration’s fiscal policy puts the lie to his claims that he is “building the economy from the middle out” versus the “top down.” His spending—and particularly the deficit spending—that he has continued long after the pandemic while real wages stay relatively flat says the opposite. (For those interested, they should look at the schedules of “Household Debt and Credit,” prepared quarterly by the Federal Reserve Bank of New York, for some troubling debt and delinquency figures, particularly among “Generation Z,” those young people aged 18–29 who are the principal drivers of family formation which drives so much of GDP.)
The administration’s fiscal policy is adding an additional trillion dollars to the national debt every 100 days. All that cash sloshing around—from fiscal and monetary policy—has, we think, artificially boosted asset prices, including home prices, above where they would otherwise be. We believe it sets up a reckoning in the future: either continued inflation (as the spending continues and deficits increase) or a sharp and perhaps lengthy recession, the kind of lengthy economic malaise we saw after the financial crisis of 2008–09.
Failing to arrest this extraordinarily dovish fiscal and monetary policy—and soon—will, we believe, result in a Hobson’s Choice of policy making (whereby multiple options available is an illusion), wherein future prosperity is at substantial risk. But we are not optimistic.
Looming ‘Gray Swans’
There are at least three looming “gray swans” facing the economy. Gray swans, as opposed to “black swans,” are events that can be foreseen, but are unlikely. Black swans are totally unpredictable. (A gray swan, for example, is comparable to a hurricane in hurricane season, whereas a black swan would be something like a devastating earthquake.)Virtually all of the looming gray swans we can foresee are attributable to bad national policy choices. They include:
• De-dollarization—The choice to try to weaponize the dollar against Russia for its invasion of Ukraine has led several nations to do direct settlements in their own currencies. We discussed the prospect of this happening here in February 2022. It has now come to be.
• Oil shock—The Gaza War, and particularly Israel’s recent deadly strike on Iran’s consulate in Syria, risks a wider war and a potential oil shock on the global market. But the national Strategic Petroleum Reserve (SPR) is at its lowest level in more than 40 years. That’s because the Biden administration tapped the SPR to artificially lower oil and gasoline prices shortly after a 2021 election loss by prominent Democrat Terry McAuliffe for his governor’s race in the blue/purple state of Virginia. New Jersey’s incumbent Democrat, Governor Phil Murphy, barely squeezed out a win over his GOP opponent in that same election cycle in that deep blue state. At the time, The Washington Post said the results showed the “wind was at the back” of the GOP. The Biden White House did the same in October 2022, shortly before the midterm federal elections.
• Chip shortages—This gray swan may have already come into being with Taiwan’s recent tragic earthquake. Reuters reports some shutdowns and some quick recoveries, but the overall effect—including the consequences of any aftershocks—are yet to be determined.
We expect GDP for the first quarter to print later this month (April 25) will be around 2.25 percent, plus or minus 25 basis points.
March’s Other Data Points
There are other data points that provide a broader perspective of the economy.The Institute for Supply Management’s Manufacturer’s Purchasing Managers Index (PMI) at 50.3 for March, for example, showed the industrial economy expanding somewhat for the first time in 16 months. (A reading below 50 signals contraction.) Most of the uptick was attributable to the increase in production, which jumped 6.2 points to 54.6.
The March ISM Services Index showed the service economy also expanding, but more slowly, at 51.4 versus 52.6 in February.
The Job Openings and Labor Turnover Survey (JOLTS) for February, released April 2, improved slightly, with 8,000 more jobs openings in February than in January, but that was offset by 110,000 more job separations in February than January. Total hires increased by 120,000.
Privately owned housing units authorized by building permits in February were at a seasonally adjusted annual rate of 1,518,000. This is 1.9 percent above the revised January rate of 1,489,000 and is 2.4 percent above the February 2023 rate of 1,482,000.
For February, personal income and outlays, released March 29, showed disposable personal income up 0.2 percent in current dollars and down 0.1 percent in chained 2017 dollars. (“Chained dollars” is a measure of inflation that takes into account changes in consumer behavior in response to changes in prices.) Personal income in current dollars was also up 0.3 percent.
The February Personal Consumption Expenditures (PCE) price index from a year ago, excluding food and energy, released the same day, and reported to be the Federal Reserve’s preferred measure of inflation, printed at 2.8 percent. PCE inflation, also called “headline inflation,” printed at 2.5 percent.
The RCP/TIPP Economic Optimism Index (previously the IBD/TIPP Economic Optimism Index) for March, released March 6, fell 1.6 percent in March, to 43.5. Optimism among investors gained 2.8 percent from 49.3 in February, to 50.7 in March, while it dropped by 2.9 percent among non-investors, from 41.3 in February to 40.1 in March.
_____________________________________
The views expressed, including the outcome of future events, are the opinions of this firm and its management only as of April 5, 2024, and will not be revised for events after this document was submitted to The Epoch Times editors for publication. Statements herein do not represent, and should not be considered to be, investment advice. You should not use this article for that purpose. This article includes forward-looking statements as to future events that may or may not develop as the writer opines. Before making any investment decision you should consult your own investment, business, legal, tax, and financial advisers. We associate with principals of Technometrica, co-publishers of the TIPP Economic Optimism Index, on survey work in some elements of our business.